Whitepapers & ebooks
Promotion Cannibalization: How to Measure What One Promo Steals From the Rest
How to calculate what a promotion takes from substitutes in the same weeks, where the estimate breaks, and what it changes in the leaflet and in replenishment.
10. november 2026
11 min

Part of every promotional uplift is demand that would have been bought anyway, only as a different brand, pack size or private label item. Counted in units of the promoted item, that transfer looks like success; counted in category margin, it can be the reason the promotion lost money. This is how to put a number on it, where that number breaks, and what to change in the leaflet once you have it.
How much of a promotional uplift is really taken from other products?
It depends on how you count, and the two common ways of counting give very different answers. Academic studies that decompose promotional response into brand switching, timing and category growth have reported brand switching shares from roughly a third to three quarters of the effect.
The high figure comes from elasticity decompositions. Bell, Chiang and Padmanabhan analyzed 173 brands across 13 product categories and found that, on average, 75% of the promotional elasticity was due to customers switching between brands, and only 25% to additional category demand (Marketing Science, 1999). For years, “three quarters of a promotion is brand switching” was the number practitioners quoted.
Van Heerde, Gupta and Wittink then showed why that number misleads anyone who runs a P&L. An elasticity measures a shift in purchase probabilities, not the units that competing products actually fail to sell. Translated into unit sales, the brand switching share fell from about 74% to at most 33% on average, and the losses on all competing brands together were less than half of the gain on the promoted brand. A follow‑up study by van Heerde, Leeflang and Wittink on store‑level data split the promotional bump into three parts: sales taken from other brands, sales taken from other weeks, and genuine category expansion. Each contributed about one third on average (Marketing Science, 2004).
The practical consequence is not one of these numbers. It is that the method decides the result. A team that reads “75%” concludes that promotions only move customers around and stops running them. A team that looks only at the promoted item sees zero cannibalization and keeps adding events to the calendar. Both are wrong for most categories, and the only way to know where your own categories sit is to measure them in units and in margin, item by item.
This guide goes one level deeper than our piece on why most retail promotions lose money, which looks at all four ways an uplift leaks away. Here we take only one of them: what a promotion takes from the rest of the range in the same weeks.
What does a promotion actually cannibalize?
A promotion takes sales from the closest substitutes in the same weeks, and the closest substitutes in the data are often not the ones a category manager would name.
In practice we see four kinds of transfer:
- Another brand in the same segment. The classic case: a branded coffee on promotion takes sales from the competing brand on the shelf next to it.
- Another pack size of the same brand. A discount on the 1.5 l bottle reduces sales of the 0.5 l six‑pack. Brand share holds, brand margin does not.
- The private label version. Often the largest and most expensive transfer, because the private label tends to carry the higher margin.
- The same item in another channel or store. A promotion in the online store pulls orders away from brick‑and‑mortar stores, or the other way round. It shows up only if both channels are measured together.
Sales cannibalization is different from two effects it is often mixed up with. The halo effect is the opposite movement: a promotion raises sales of complementary items. The post‑promotion dip is a shift in time for the promoted item itself. All three sit inside the same uplift, and all three have to be separated before the result of a promotion means anything.
The private label relationship deserves its own attention. Horváth and Fok studied cross‑brand effects of price promotions in 33 categories across five stores, 165 store and category combinations in total, and found that the asymmetry between national brands and private labels had the strongest influence on how much one promotion affected the others (Marketing Science, 2013). For a retailer, that is where cannibalization is most likely to cost real money.
How do you calculate the cannibalization rate of one promotion?
For each substitute, subtract actual sales from the baseline it would have sold without the promotion, add the differences up over the promotion weeks, and divide by the uplift of the promoted item. The calculation is simple. The work is in the four steps that feed it.
- Define the cannibalization group. The set of items that customers can realistically switch to: same segment, same need, comparable price band. The group decides the result more than any formula.
- Build a baseline for every substitute. The baseline has to be cleaned of each substitute’s own promotions, seasonality and stockouts, otherwise a substitute that was out of stock looks cannibalized.
- Use only the promotion weeks. The post‑promotion dip belongs to a different question and is measured separately.
- Convert to margin. A unit taken from a low‑margin brand and a unit taken from a high‑margin private label are not the same loss.
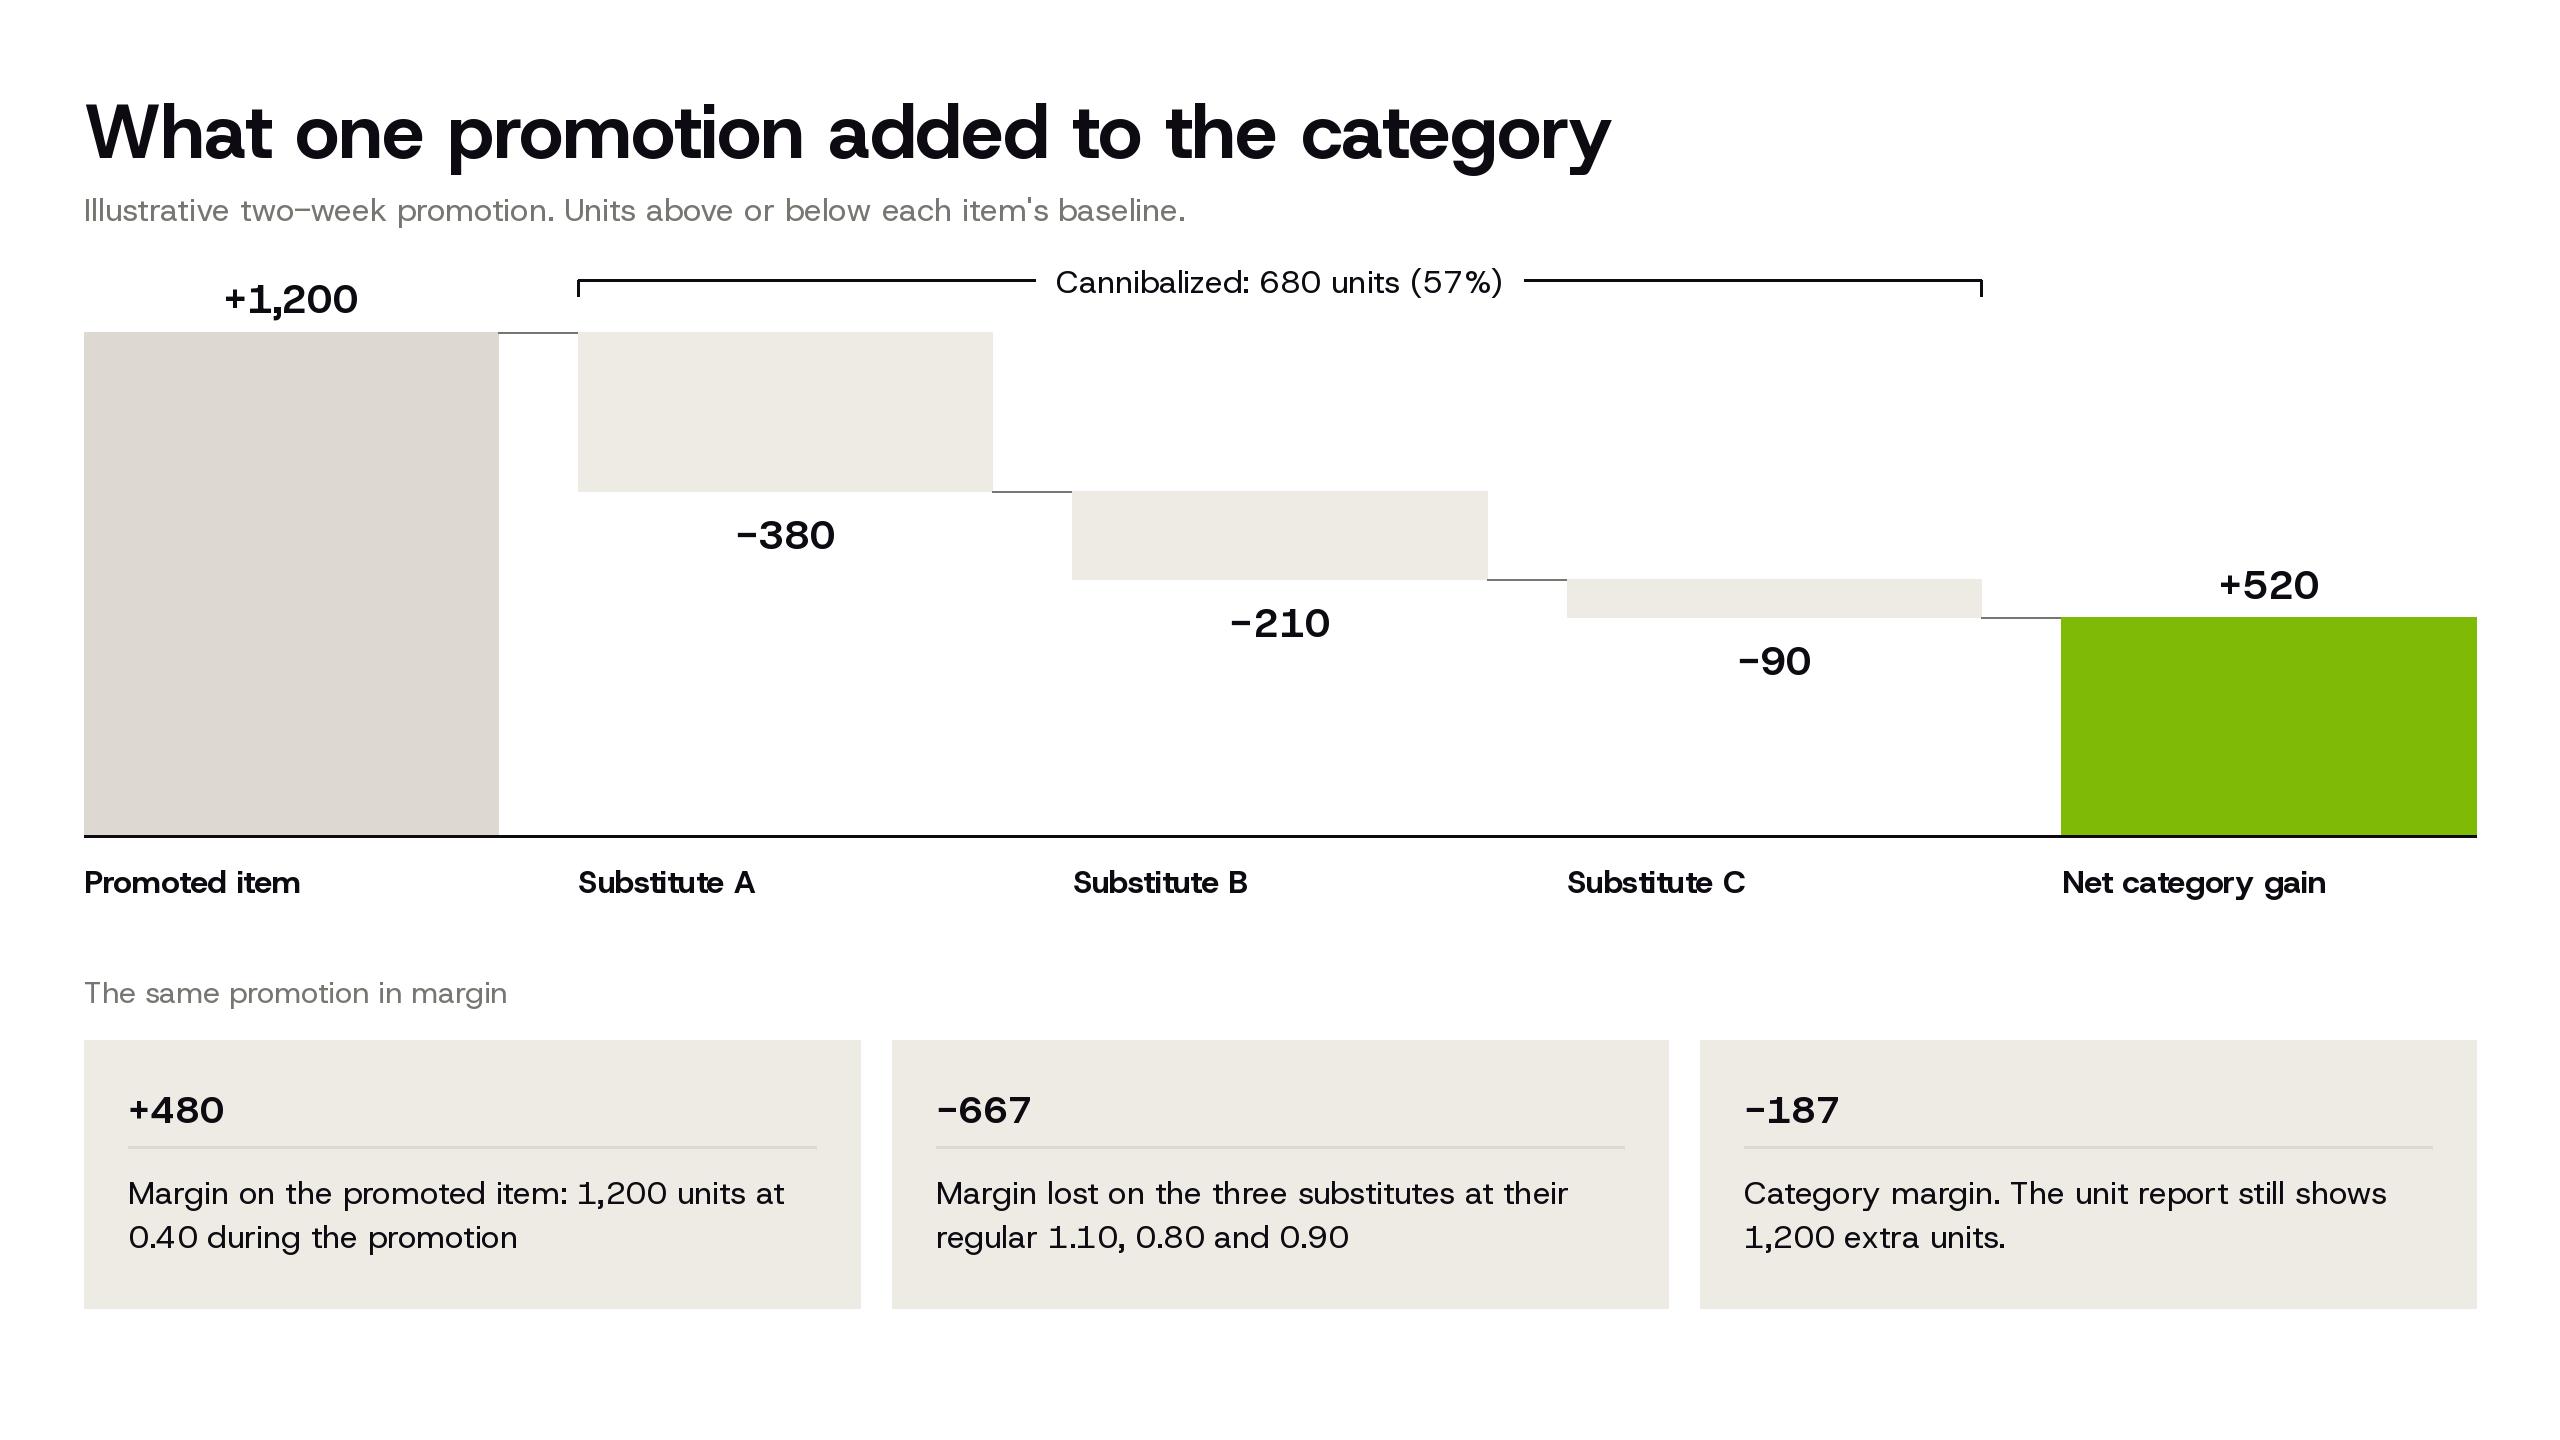
An illustrative example, with numbers chosen to show the mechanics rather than taken from a specific client: a promoted item sells 1,200 units above its baseline in a two‑week promotion. Three substitutes in its group sell 380, 210 and 90 units below their baselines over the same two weeks. Cannibalization is 680 units, the cannibalization rate is 57%, and the category gained 520 units, not 1,200.
Now the margin. If the promoted item earns 0.40 per unit during the promotion and the substitutes would have earned 1.10, 0.80 and 0.90, the promotion added 480 in margin on the promoted item and removed 418 + 168 + 81 = 667 on the substitutes. The category lost 187 on a promotion that the unit report shows as 1,200 extra units. This is the comparison our uplift and cannibalization analysis in Veritico PROMO makes for every promotion, against a calculated baseline per item and store.
Where does the estimate break?
The estimate breaks in four places, and each one pushes the number in a different direction. Knowing which way it is biased matters more than a second decimal place.
A group that is too wide or too narrow. A group that covers a whole category of unrelated items dilutes the effect into noise, and cannibalization comes out close to zero. A group that is too narrow misses the substitute customers actually switched to, and the effect disappears for a different reason. We start from the category tree, then check which items actually lose sales in promotion weeks across several past events, and adjust the group to what the data shows.
Overlapping promotions. When two items in the same group are on promotion in the same week, they take sales from each other and from the rest of the group at the same time, and a simple baseline subtraction cannot tell which promotion caused what. Horváth and Fok found that competitive reactions accumulate rather than cancel out cross‑price effects, so two overlapping events tend to cost more than the sum of their separate estimates would suggest. A promotional calendar with heavy overlaps needs a model that estimates the effects jointly; a spreadsheet will quietly assign the loss to whichever promotion it looks at first.
A stockout on the promoted item. When the promoted item runs out halfway through the promotion, customers go back to the substitutes. Sales of the substitutes recover, cannibalization looks smaller than it was, and the uplift of the promoted item is capped by stock, not by demand. Any promotion with a stockout should be flagged and either corrected or left out of the benchmark.
Leaflet, display and price in one package. Most promotions combine a discount with a leaflet position, an in‑store display or both, and each of them moves demand differently. Van Heerde, Leeflang and Wittink found that discounts supported by a leaflet feature were strongly associated with shifting purchases in time, while discounts supported only by a display showed especially strong category expansion. If promotions are recorded without the mechanic, the cannibalization estimate mixes several effects that call for different decisions.
Why can a promotion with no lost units still lose money?
Because cannibalization is paid for in margin. When customers move from a private label with a higher margin to a discounted brand, the category sells the same number of units and earns less on every one that switched. A unit report records that as a successful promotion.
The direction of the transfer is not a law of nature either. It is tempting to assume that a discounted national brand always takes sales from the private label and never the other way round. Bronnenberg and Wathieu showed that the direction depends on how the brands are positioned: in orange juice, lower‑quality, lower‑priced brands promoted more effectively, while in peanut butter the opposite held (Marketing Science, 1996). The same retailer can see both patterns in two neighboring categories, which is why a rule written once for the whole store tends to be wrong in half of it.
There are also cases where switching is exactly what the promotion should do:
- Trade‑up. A promotion that moves customers from an entry‑price item to a higher‑margin one cannibalizes in units and gains in margin.
- Supplier funding. If the supplier funds the discount and the cannibalized items are lower‑margin, the transfer can pay for itself.
- Defense. A promotion that keeps customers in the category during a competitor’s campaign may cannibalize and still be worth running.
All three are decisions you can only make deliberately if the cannibalization is measured. Without it, every promotion looks like a trade‑up.
What changes in the leaflet and in replenishment once you can see it?
Three decisions change: which items go into the same week, which items go into the leaflet at all, and how much of the substitutes you order while the promotion runs.
Do not put close substitutes into the same week. Two promotions in one cannibalization group mostly fight over the same customers. Moving one of them to another period often keeps most of the uplift of both.
Choose leaflet items by net category gain, not by uplift. The item with the biggest spike is not necessarily the one that adds the most to the category. Ranking candidates by what the category gained after cannibalization, in margin, usually changes the leaflet more than fine‑tuning the depth of the discount. At METRO Slovakia, Veritico PROMO selects and ranks promotional candidates and assembles the leaflet for each period. The leaflet shrank by a quarter with sales unchanged, promotional margin rose by one percentage point and profit on promoted items by 3%.
Lower orders for the substitutes. If substitutes are ordered to their normal forecast during a promotion, the demand that moved to the promoted item stays on their shelves. In fresh and short‑life categories, it ends as write‑offs a week later. A promotional forecast that reduces demand for the cannibalized items, and replenishment that uses it, closes the loop. At Kofola, connecting promotion planning across business units brought promotional forecast accuracy to 76% and cut write‑offs of expired stock by 14% (case study).
The third decision is the one most often missed, because promotion planning and replenishment sit in different teams. Cannibalization is the point where they have to share one number.
When is measuring cannibalization not worth the effort?
When the share of sales on promotion is small, when the promoted items have no close substitutes, or when there is not at least one full seasonal cycle of history to build the baselines from. In those cases the estimate costs more than the decisions it can change.
Other limits we run into on projects:
- New listings. An item without sales history has no baseline, and neither does the effect it has on its neighbors. Use analogous items for the first season and measure properly from the second.
- Categories with one dominant brand. If there is no realistic substitute, cannibalization is close to zero by construction and the question is about pull‑forward instead.
- Small stores with sparse sales. At one or two units per item per week, noise outweighs the effect. Measure at the level of a store cluster, not an individual store.
In these situations, the simple test and control approach described in our piece on promotion profitability, run on a handful of selected promotions, gives a more useful answer than a model fitted to data that cannot support it.
Frequently asked questions
There is no single normal rate. It varies strongly by category, mechanic and the role of the private label. Academic decompositions put the share of a promotional uplift taken from other brands between roughly a third and three quarters, depending on whether it is measured in units or in elasticities. The reliable answer for a specific range comes from its own sales data.
No. A promotion that moves customers to a higher‑margin item, one where the supplier funds the discount, or one that keeps customers in the category during a competitor’s campaign can be worth running despite cannibalization. The problem is cannibalization that nobody measured.
Cannibalization is a shift between substitutes in the same weeks. The halo effect is extra sales of complementary items. The post‑promotion dip is lower sales of the promoted item after the promotion, because customers bought ahead.
For one promotion and a few substitutes, yes. For hundreds of promotions a year with overlapping mechanics, no, because the effects of overlapping promotions have to be estimated together and the baselines have to be recalculated for every item and store.
From our projects

Optimizing promotion mix for a leading soft drinks producer
Veritico PROMO unified data across departments, raised promotional forecast accuracy to 76%, and cut write‑offs of expired stock by 14%, leading to better availability at the shelf.
76% promotional forecast accuracy
14% fewer write‑offs of expired stock
Higher product availability

Promotion planning for Mondelez
Since 2011, Logio helped Mondelez unify planning and raise forecast accuracy from 50% to 70%, improving promotion decisions and cross‑functional alignment.
+20 pp forecast accuracy
Promotion profitability increased
More supply chain insights
Supply chain glossary
Discrete Event Simulation
What discrete event simulation is, how it differs from a spreadsheet capacity calculation and why a single run or an uncut warm‑up period misleads.
11. november 2026
2 min
Supply chain glossary
Digital Twin
What a digital twin is, how it differs from a one‑off simulation model and why it has to replay a recorded week before its scenarios can be trusted.
10. november 2026
3 min

Supply chain glossary
Bill of Materials (BOM)
What a bill of materials is, how engineering and manufacturing BOMs differ and why a missing scrap factor turns into stock that exists only in the system.
09. november 2026
2 min