Whitepapers & ebooks
Assortment Rationalization: How to Cut SKUs Without Losing Sales
Most delisting business cases assume all demand transfers to the remaining range. It doesn't. How to estimate transfer before you cut, and where the savings really are.
27. august 2026
11 min
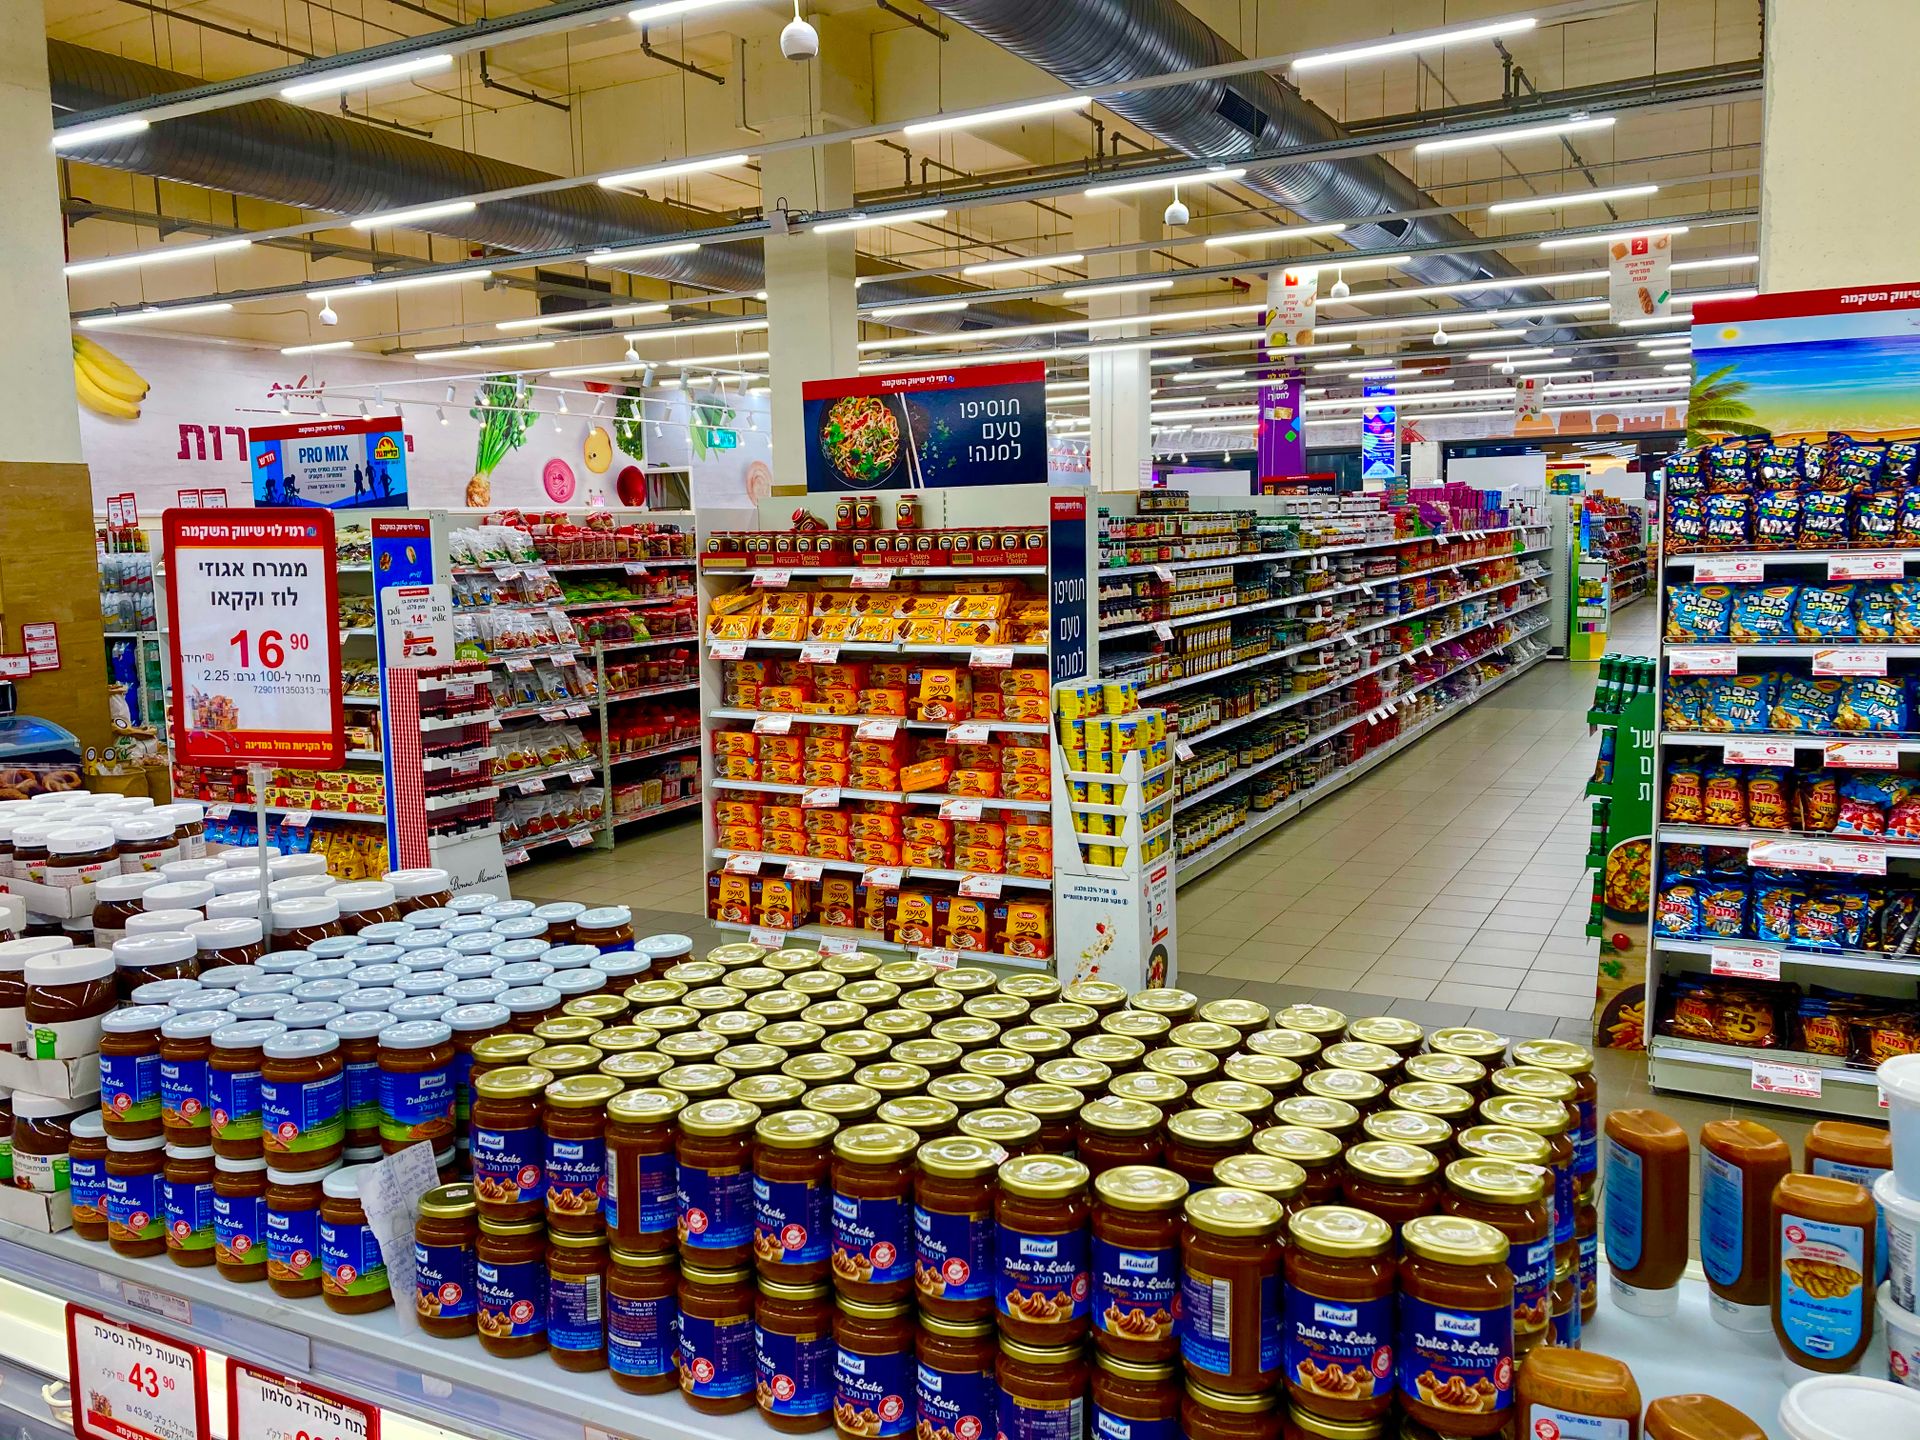
Cutting SKUs looks like free money: fewer items, less stock, lower complexity. The reason it so often ends with lower sales and roughly the same inventory is that most delisting decisions never estimate how much demand actually moves to the products that stay.
Why SKU cuts rarely deliver what the business case promised
The savings in a rationalization business case are calculated on the products being removed. The result depends on something else entirely: how much of their demand transfers to the rest of the range. Most business cases never state that number, which means they have silently assumed it is 100 percent.
It is not. Some customers switch to a similar product, some leave the category, and some buy nothing at that visit. If the true transfer rate is 60 percent and the plan assumed full transfer, the arithmetic changes completely. Delist products worth 4 percent of category revenue, transfer 60 percent of it, and the category loses roughly 1.6 percent of sales that nobody budgeted for.
Inventory rarely falls the way the plan says either. Safety stock exists to cover variability, and when demand consolidates onto fewer items, the variability consolidates with it. The remaining products need deeper cover, so a large share of the stock you released comes straight back. The count of SKUs in the catalogue drops immediately. Working capital moves far less.
The pattern behind most disappointing rationalizations is the same: the decision was made on item revenue. Revenue tells you what a product sells. It does not tell you what happens to the customer who came for it, which is the only thing that determines whether removing it is free or expensive.
What demand transfer is, and how to estimate it before you delist
Demand transfer is the share of a delisted product’s demand that customers redirect to other products you still carry, rather than taking it to a competitor or not buying at all. It is the single variable that decides whether a delisting is profitable, and it can be estimated from data most retailers already have.
The cheapest source is your own out‑of‑stock history. Every stockout is a natural experiment: the product was unavailable, customers reacted, and the reaction is recorded. Compare category sales in the affected stores during those windows against comparable stores where the item was in stock, and the gap is a first estimate of how much demand walks away. It is imperfect, because a stockout is temporary and a delisting is permanent, and customers behave differently when they expect the product to come back. It is still a far better starting point than assuming full substitution.
Beyond that, three factors move the transfer rate:
- Substitution distance. Two pack sizes of the same product transfer almost fully. Two different brands transfer less. A product with a distinctive attribute, a flavour, a technical specification or a size at the edge of the range, often transfers barely at all, because the customers buying it are the ones for whom nothing else works.
- Brand versus private label. Transfer between manufacturer brands and private label is asymmetric. Removing a private label line usually pushes demand to the brand and costs margin even when volume holds. Removing a brand can push loyal buyers out of the store entirely.
- Shopping mission. In categories people visit for choice, the range itself is the reason for the trip. Thinning it changes traffic, not just item mix, and the loss shows up in the basket rather than the category.
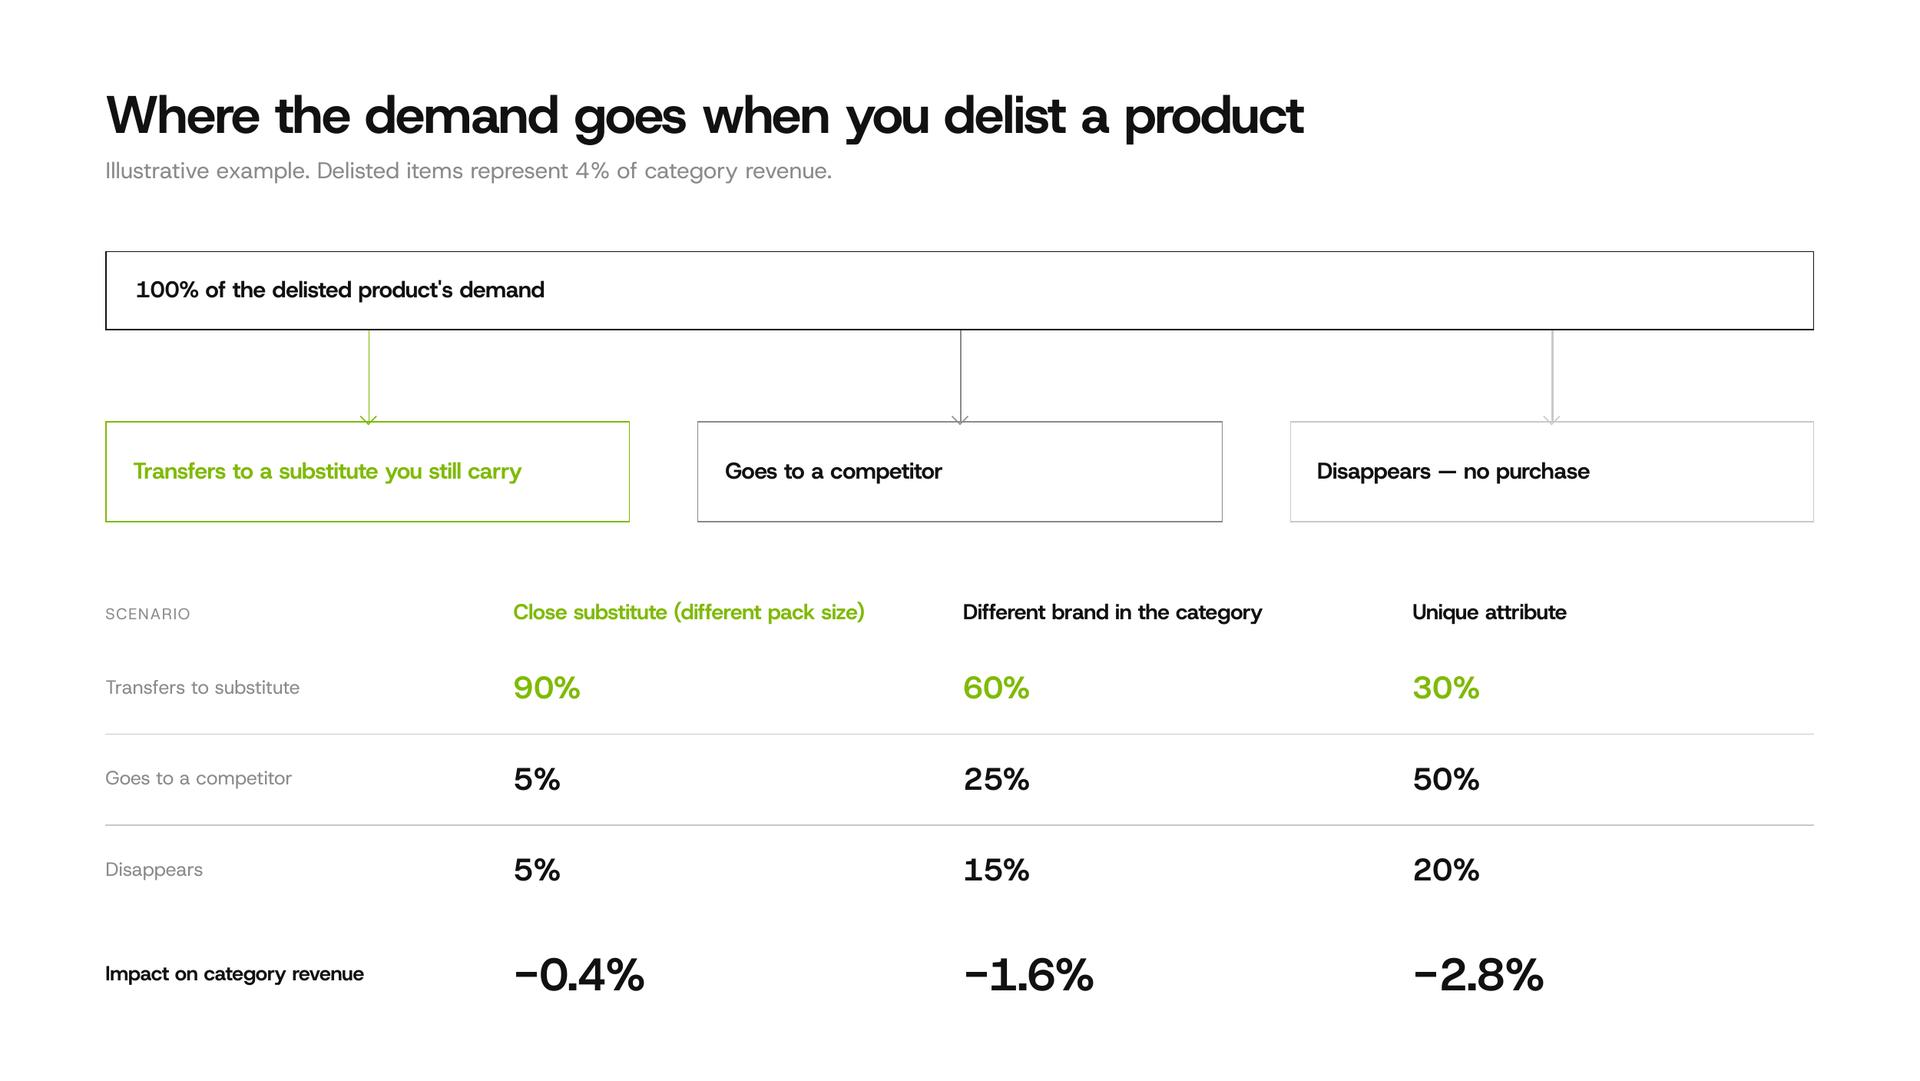
None of this requires a research project. It requires deciding that the number matters enough to estimate before the delisting list is approved, not after.
Four questions to ask about every delisting candidate
ABC analysis is where most rationalizations begin, and it is a reasonable input. It is not a decision. A product in the D group that 8 percent of category shoppers buy as their only item in that segment is a trap, and the ABC table cannot see it.
Four questions separate the safe cuts from the expensive ones:
What role does the item play? Traffic driver, profit driver, image product, or filler. Roles are assigned as part of category strategy, and a filler with weak sales is a genuinely different case from an image product with weak sales that keeps the category credible.
How much of its demand transfers? The estimate from the previous section, expressed as a range rather than a point. If the honest answer is “somewhere between 40 and 90 percent,” that uncertainty belongs in the business case.
How many customers buy it as their only item in the category? This is the exclusivity test, and it is the one most often skipped. Two products with identical revenue can have completely different customer overlap, and the one bought by a distinct group is the one that costs you shoppers rather than units.
What does removing it do to supplier terms? Volume rebates, listing fees and bonus tiers are often negotiated at supplier level. Cutting three slow items can push you below a threshold and cost more in lost rebates than the items ever tied up in stock.
Logio built exactly this decision logic into a BI tool for Arctic Fox, the Czech distributor for Fjällräven: instead of static reports, the tool answers the listing, inventory structure and promotion questions directly, so the decisions rest on evidence rather than on last quarter’s revenue table.
Where the savings actually come from
For a CFO, the honest framing is that rationalization is rarely a sales story. It is a cost and capital story, and the savings sit in five places:
- Working capital, though less than proportionally. Fewer SKUs mean fewer stock positions, but safety stock aggregates rather than disappears.
- Space, in the warehouse and on the shelf, which only converts into money if the released space gets used for something or the network avoids an expansion.
- Purchasing and replenishment effort: fewer order lines, fewer supplier conversations, fewer parameters to maintain.
- Write‑offs and markdowns on products that would have aged out anyway.
- Forecast quality, indirectly. Demand consolidated onto fewer items is statistically easier to forecast, which lowers the safety stock those items need.
The clean‑up of the delisted stock deserves its own line in the plan, because it is where the savings often evaporate. Blanket discounting is the most expensive way to clear it; there is a more precise approach to markdowns that protects a meaningful part of the margin.
Scale changes the arithmetic. GGT, the largest tobacco distributor in Slovakia, runs 9,500 SKUs across 14 regional warehouses supplying more than 800 branches. At that width, small percentage improvements in how the range and its replenishment are managed produce large absolute numbers. The Veritico STOCK deployment there is associated with roughly €25 million in additional annual turnover and about €1 million less stock. A retailer with 900 SKUs in one warehouse is playing a different game and should expect different results.
Chain‑level or store‑level? The most expensive shortcut
Removing a product everywhere because it underperforms on average is the fastest way to lose sales in the stores where it worked. Averages hide the stores that carry the exception, and those stores are usually the ones with the most distinct local customer base.
Localization is the difference between a rationalization that holds and one that gets quietly reversed six months later. In practice it means clustering stores by demand pattern rather than by size or region on a map, setting a minimum volume threshold below which a local listing is not worth the replenishment cost, and keeping deliberate exceptions with an owner and a review date.
This matters more in Czechia and Slovakia than most international sources suggest. Retail here still runs a large number of small‑format and regionally anchored stores, from cooperative networks and tobacconists to convenience channels and franchise operations, where local preference is strong and store‑level volumes are low enough that a single listing decision is visible in the numbers. Sportisimo operates 234 stores across both countries; GGT reaches 470 points of sale. A single chain‑wide rule applied to that kind of footprint will be wrong in a predictable share of locations. The question is whether you know which ones in advance.
The counterweight is real and worth stating: every exception costs something in replenishment complexity, forecasting accuracy and store operations. Localization is not a licence for a thousand local ranges. It is a decision about where the exception earns more than it costs.
When not to rationalize
Four situations where the answer is to wait or to solve something else first.
You are mid‑migration. During a warehouse move or an ERP or WMS go‑live, the data you would base the decision on is unstable and the organization has no capacity to monitor the effect. Rationalize before or after, not during.
You have no view of substitution. If the transaction data does not let you see basket composition or reconstruct stockout periods, the transfer estimate is a guess. Fix the data first; it is a matter of weeks, not quarters, and it is worth more than the delisting list.
The actual problem is availability. A broad range at 92 percent availability looks exactly like an assortment problem and is not one. Customers do not care whether the shelf is empty because the product was delisted or because it did not arrive. Cutting the range while availability is the constraint removes revenue without fixing the cause, and better forecasts alone will not fix it either, because the gap is usually in execution.
The category’s job is choice. Where breadth is why customers come, the range is the product. Rationalize the tail there and the traffic goes with it.
How to run it so the result is measurable
A rationalization that cannot be measured will be argued about instead. The structure that avoids that:
- Start with two or three categories, not the whole assortment. Pick ones with different roles so you learn something transferable.
- Hold a control group of stores. Without it, seasonality and market movement will be blamed for any decline, and nobody will be able to prove otherwise.
- Measure at category level, never at item level. The delisted product will always show a loss, because it no longer exists. Only the category tells you whether demand transferred.
- Decide after a full seasonal cycle. Transfer is slow. Customers need several visits to change habit, and the early weeks overstate the loss.
- Write down the expected transfer rate before you cut, then compare it to the actual. That comparison is the asset: after two or three categories, the estimates for everything else get considerably better.
Veritico RANGE runs this logic continuously rather than as a one‑off project: substitution and demand transfer are modelled from your own transaction data, and range decisions are proposed per cluster instead of per chain average. The assortment strategy and rationalization work usually starts with one category and the question of what would actually happen if those items disappeared.
Frequently asked questions
What is the difference between assortment optimization and assortment rationalization?
Assortment optimization is the broader decision about which products to carry, where and in what depth, including adding products and changing range depth. Rationalization is the subset focused on removing items and simplifying the range. Optimization can conclude that a category needs more products, not fewer.
How many SKUs should we cut?
There is no defensible universal figure, and any number offered before the substitution analysis is a guess. The question to answer first is which items customers would not replace, and that share differs enormously between categories.
How do you know whether demand will transfer to another product?
Estimate it from your own data: sales during past stockouts compared against control stores, basket overlap between candidate items and their nearest substitutes, and response to price changes within the substitution group. Express the result as a range and put it in the business case.
How long does it take to see the effect of SKU rationalization?
Inventory and complexity effects appear within one replenishment cycle. The demand effect needs a full seasonal cycle, because customers change habits over several visits, and the first weeks after a delisting overstate the loss.
Talk to an Expert. Pick one category, and we will estimate demand transfer on your data before anything gets delisted.
More supply chain insights
Supply chain glossary
Multi‑Echelon Inventory Optimization (MEIO)
Multi‑echelon inventory optimization sets stock levels across every stage of a supply network at once, instead of optimizing each location separately.
18. september 2026
3 min
Supply chain glossary
Vendor Managed Inventory (VMI)
An arrangement in which the supplier decides what and when to ship, based on stock and sales data the customer shares.
17. september 2026
3 min
Supply chain glossary
Stock Keeping Unit (SKU)
The identifier a company assigns to a separately managed item, and the level at which demand, stock and orders are actually planned.
16. september 2026
2 min