Production Capacity Planning
See where capacity will fall short before your customer does. Capacity Tool compares production requirements against the real capacity of your machines and people, uncovers hidden bottlenecks, and lets you test scenarios (higher demand, more operators, a new machine) before you commit to an investment or turn down an order.
Deployed at Honeywell Aerospace, in an operation with more than a million labor hours a year.

Why it matters
The totals look fine. Individual workcenters are on fire.
Capacity planning in Excel shows aggregates, not reality. And the reality is that machines and people are two different constraints – and decisions come too late.
Hidden bottlenecks beneath the aggregate
A group of workcenters shows utilization below 100 % in total, yet it fails to deliver on time. The work piles up on one overloaded machine even though other machines could take it over. The total is deceptively reassuring.
Machines and people are two different limits
Sometimes a machine is missing; sometimes the machines are there but no one can run them. Without a separate view of machine and labor capacity, you end up solving the wrong problem: buying a machine when you are short of operators.
Setups, scrap and rework eat your capacity
In practice, the theoretical capacity of a machine is cut down by downtime, multi‑machine operation, missed cycle times, setups and scrap. If you plan for full uptime, you plan with numbers that never happen on the shop floor.
The “buy or decline” decision comes too late
You deal with a machine investment, a new shift or declining an order only once capacity has already overflowed. What is missing is a forward view where you can verify the impact of a decision before you make it.
What the tool does
From production requirements to machine and labor capacity. Evaluate the scenario before you decide.
Every screen answers a specific question a production director asks. We configure the tool to match the structure of your operation.
Master plan: the complete production requirement
See exactly what production has to deliver – in pieces and hours, by item and over time. Drill down from product groups to a specific part and its routing. Benefit: a single source of truth about what to produce and when.
Traffic lights reveal machine bottlenecks
Shows the load of every workcenter against its real capacity. Green keeps up, yellow means poorly routed work, red signals a bottleneck that will stop production. Benefit: you know exactly where to move work, where to add capacity, and where buying a machine is unavoidable.
Labor capacity, not just machines
Shows how many operators you have, how much they should work per shift, and how much they actually worked. Reveals where people are missing and how much an external supplier can cover. Benefit: a solid basis for hiring and shift planning.
Plan versus reality in one table
Compares the net requirement, the requirement including setups and scrap, the contribution of external sources, remaining capacity, and the gap between theoretical and historical utilization. Benefit: hard data for purchasing and controlling.
Test a decision before you make it
Simulate higher demand, added people or a new machine, and compare the scenario against the baseline plan. See the impact on every workcenter before you commit any budget. Benefit: investment and hiring decisions backed by data.
Capacity mapped onto your shop floor
Shows workcenter utilization directly in the production layout. You see bottlenecks exactly where they physically are, not just as a row in a table. Benefit: a clear conversation with supervisors and management over a specific spot.
Key feature: scenarios
What happens when demand for one product jumps 50 %?
No need to guess. In a scenario, you raise the output of a specific product, add people or a machine, and the tool immediately shows the impact on capacity. You see the difference against the baseline plan workcenter by workcenter – a calculation that used to take weeks, available instantly.
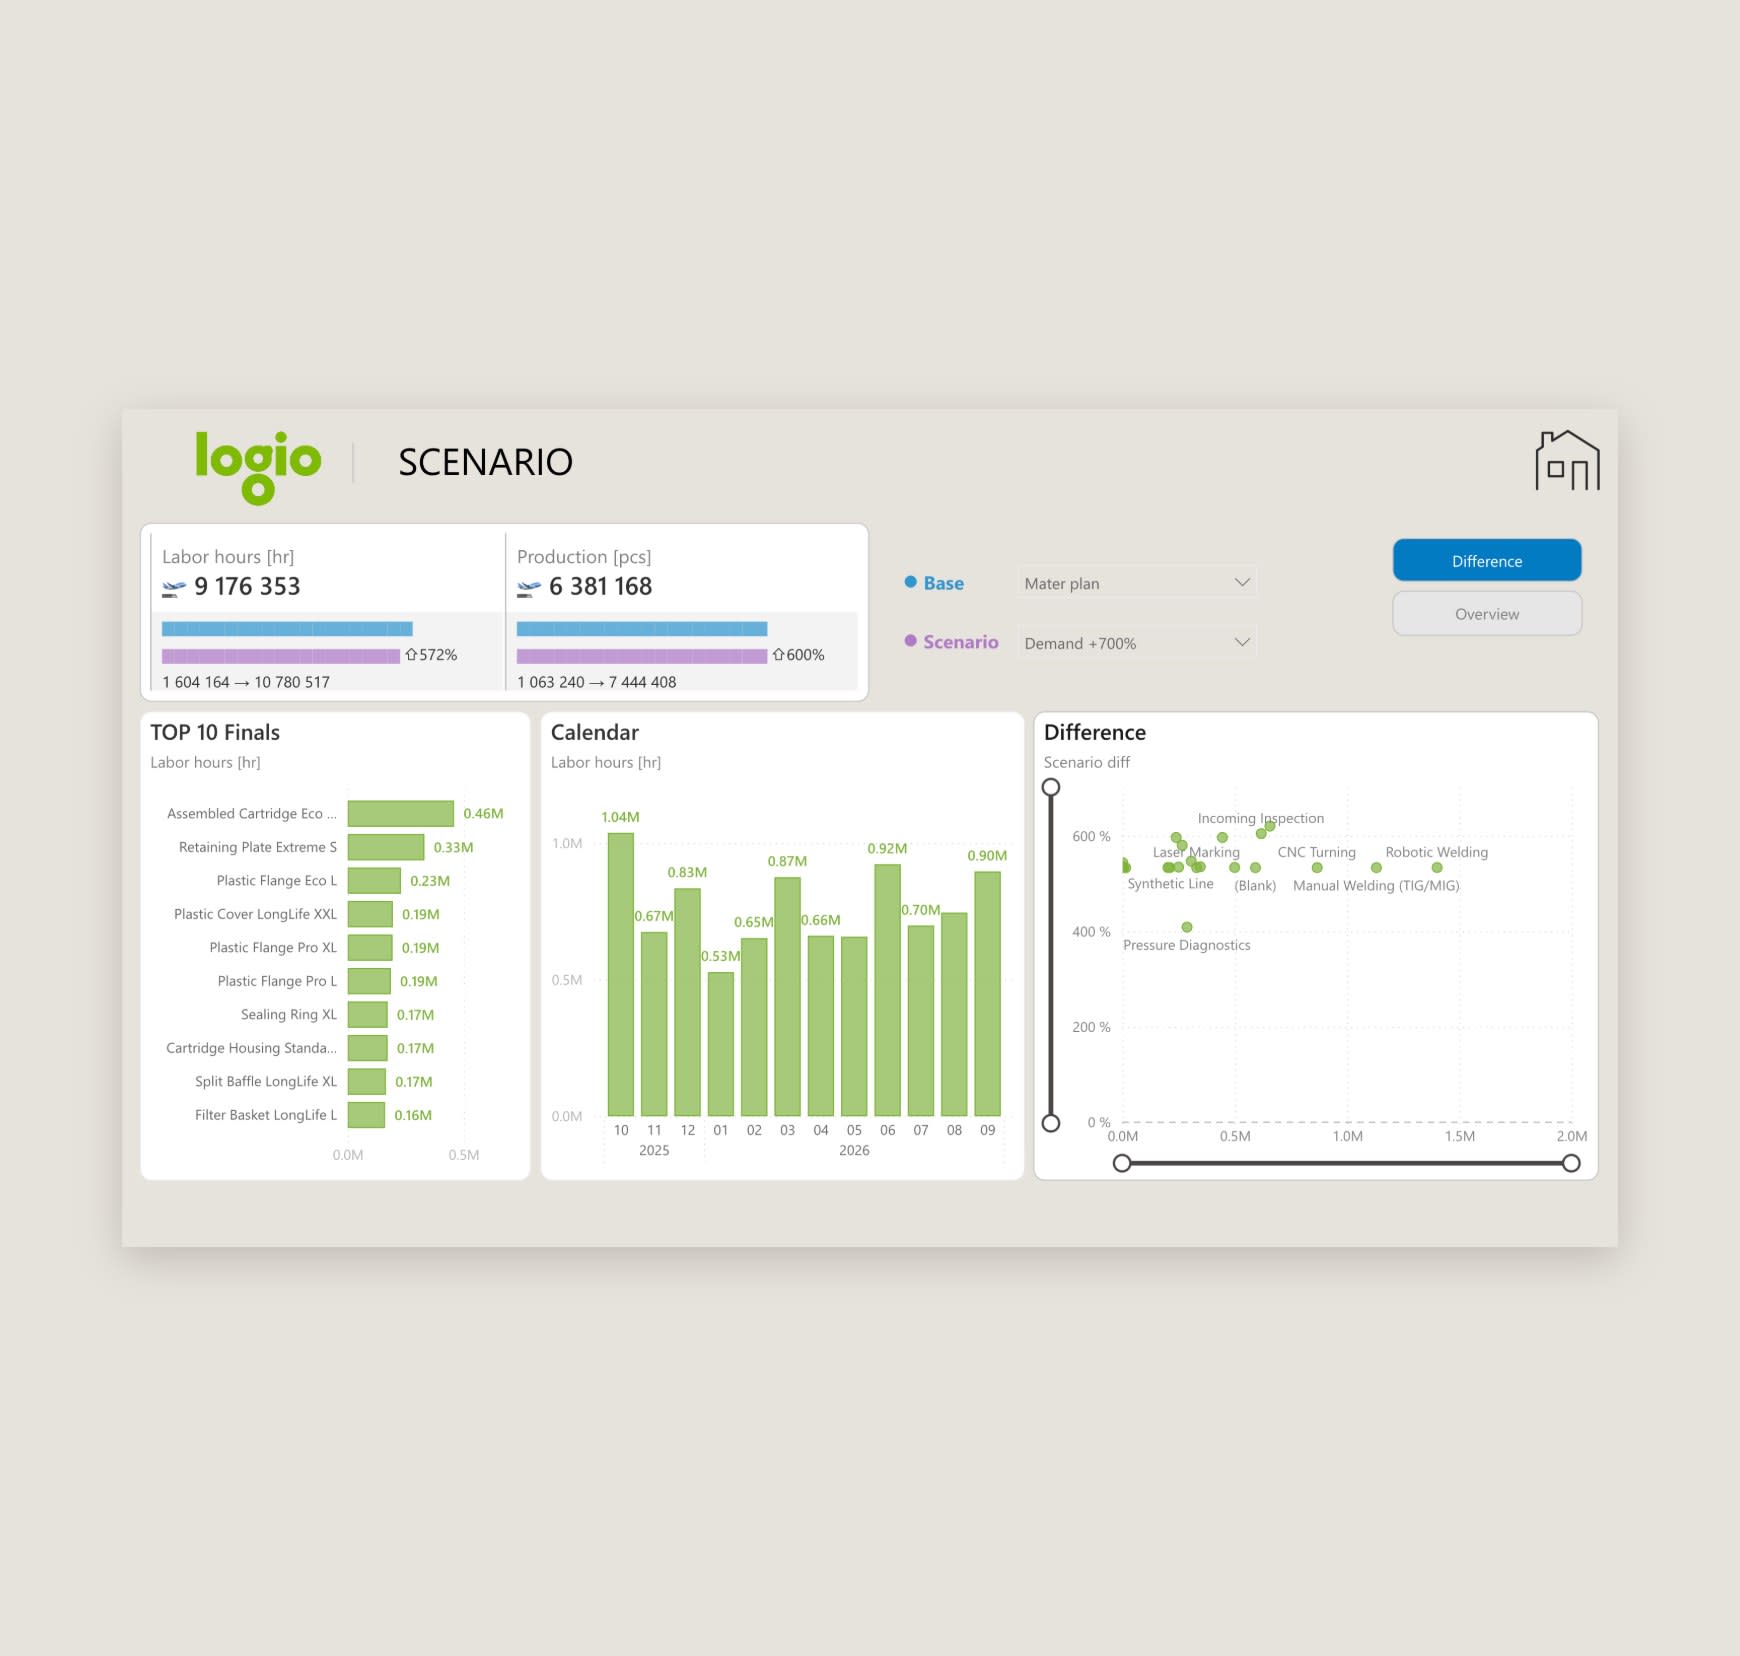
The Difference view: scenario versus baseline plan
- Pick the baseline master plan and create a new scenario.
- Set the change: +50 % output of a selected product, more operators, or a new machine.
- Compare the scenario with the baseline and see which workcenters turn red – before you approve the decision.
Demo data is illustrative.
Get demo access
Enter your work e‑mail and we will send you demo access. No meeting, no phone call – explore the tool at your own pace.
A look inside
Real screens, not glossy mockups.
Actual previews straight from Capacity Tool. They come from the demo environment and illustrate functionality; they are not results of a specific operation.
Reference
Built on the reality of aerospace manufacturing.
Logio Capacity Tool runs at Honeywell Aerospace, in a production operation with more than a million labor hours a year. The logic of machine and labor capacity and scenario simulation grows out of the real demands of that industry.
Under the hood
Built on Microsoft Power BI.
No new platform to maintain. The tool runs in your Microsoft environment, so your production data stays under your control.
Microsoft Power BI
Reporting and visualization run on Power BI. Refresh data several times a day and always work with the current state.
Your data
We draw on data from your ERP and production planning systems (demand, routings, capacities, shifts). We build the integration to fit.
Scenarios via Teams
Enter new scenarios through an agent in Microsoft Teams (Copilot Studio) or via Power Apps. The change writes back to the data and the report recalculates immediately.
Your environment, your data
The solution runs in your Microsoft infrastructure and production data never leaves it. Sign‑in with corporate accounts (Entra ID), access managed by your rules.
How deployment works
Deployed in 3 to 6 months. We build on what you already have.
Three months with full cooperation, roughly six months alongside day‑to‑day operations. We define the exact scope after the initial analysis.
01
Analytical workshops
We go through your production and data sources: your ERP setup, how you track cycle times, shifts and routings. A month of analysis results in a precise scope and schedule.
02
Data integration
We connect demand, routings, workcenters and the shift calendar. No changes to your ERP – we work with interfaces and exports.
03
Tailored configuration
Views carry the names of your departments, workcenters and products. We set up filters, charts and traffic‑light rules to match exactly how you run production.
04
Operations and support
Data refreshes automatically, several times a day if needed. We handle model and view changes as part of ongoing support – you are not left on your own.
How the tool calculates capacity
We start from the full operation of a workcenter and subtract the factors that genuinely reduce capacity: planned maintenance and downtime, multi‑machine operation (the machine waiting for an operator), deviations from cycle times, inefficiency, setups, and scrap with rework. The result is capacity you can rely on, not a theoretical maximum.
Green confirms the workcenter keeps up with demand. Yellow is a warning: total capacity is sufficient, but work piles up on one busy machine even though it could be redistributed. Red marks a critical bottleneck: capacity falls short even in total, and without a new machine or a change in production the demand will not be met.
We compare demand separately against machine and labor capacity – the constraint can sit on either side. For people, we track headcount, per‑shift targets and hours actually worked. The model also includes external capacity (dual sourcing), so you immediately see how much of the missing capacity subcontracting covers.
Alongside the baseline plan you create a simulated scenario (say, higher demand for selected products, more operators or a new machine) and the tool compares both states workcenter by workcenter. You see precisely where the scenario creates – or relieves – a bottleneck before you roll the change out in reality.
What production directors ask us first
Yes – and it is a more common starting point than you would think. You don’t need perfect cycle times or flawless master data. We start with what you have. The tool actually surfaces the discrepancies quickly: the gap between theoretical and historical utilization points to the exact places where cycle times don’t match reality. Data cleanup then has a concrete target instead of a blanket revision.
Between them – each solves a different level of control. Excel shows aggregates but hides bottlenecks, the split between machine and labor capacity, and scenarios. APS runs the operational detail: daily plans, job sequencing on machines, changeover minimization. It works with released production orders, not a long‑term forecast, so the mid‑ and long‑term capacity outlook is often missing entirely. Capacity Tool targets exactly that outlook: it works with the master plan and the forecast, runs on Power BI over your data, and replaces neither ERP nor MES. If you move to APS later, the data analysis from the project carries over.
A typical project comes in at tens of thousands of euros, depending on the number of machines and workcenters and the scope of simulation modules. It includes monthly service support covering adjustments, further development and any incidents. You pay for a tailored implementation, not licenses for yet another piece of software. For comparison: APS systems with a capacity module mean an order of magnitude larger investment and years of rollout. Capacity Tool is the interim step that answers your capacity questions at a fraction of the cost and time.
Routine changes (new orders, items, shift adjustments) flow in automatically with data refreshes from your systems. Structural changes – a new workcenter, a different view layout or new traffic‑light logic – are handled by us as part of support. You don’t need your own Power BI developer to run it.
The tool is fully configurable. Views can be split by plant, hall or department, and we adapt the filters to your structure. The same traffic‑light and scenario logic then works at the level of a single workcenter or a whole group.
Day‑to‑day work belongs to the production planner: checking bottlenecks, moving work, evaluating scenarios. The production director uses the overview reports for investment and order decisions. Purchasing and HR pull data on capacity gaps – whether that means subcontracting or hiring.
ERP exports (orders or the demand plan), routings with cycle times, a list of workcenters and machines, and the shift calendar. The data doesn’t have to be perfect – we start with what you have.
Try it yourself. No meeting needed.
Leave us your contact details and we’ll send you demo access. Explore machine and labor capacity, bottlenecks and scenarios at your own pace. And when you’re ready, we’ll go through the results together over your production data.