Infographics
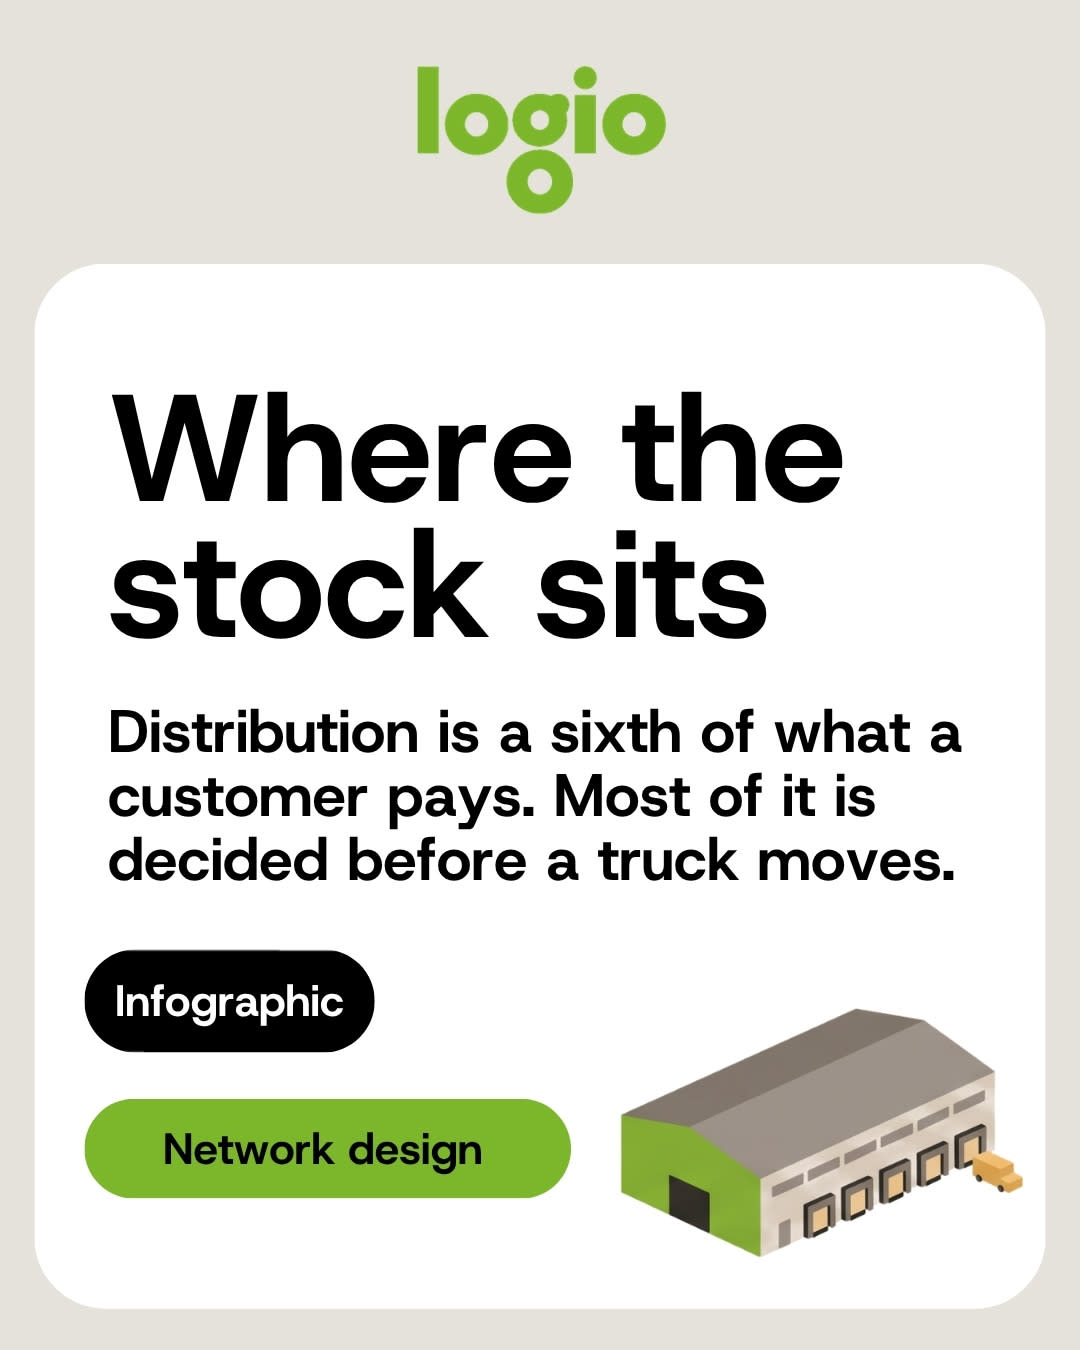
Where the stock sits: how a distribution strategy is built
Distribution takes about a sixth of the retail price, and four fifths of that is settled before a single truck moves. What goes into a distribution model, and why the obvious answer is usually the expensive one.
13. september 2026
3 min

Distribution takes about a sixth of the retail price of a product, and four fifths of that is settled by decisions made long before daily operations start. Where the warehouses sit, how the regions are split and how often you deliver — that is the part worth modeling.
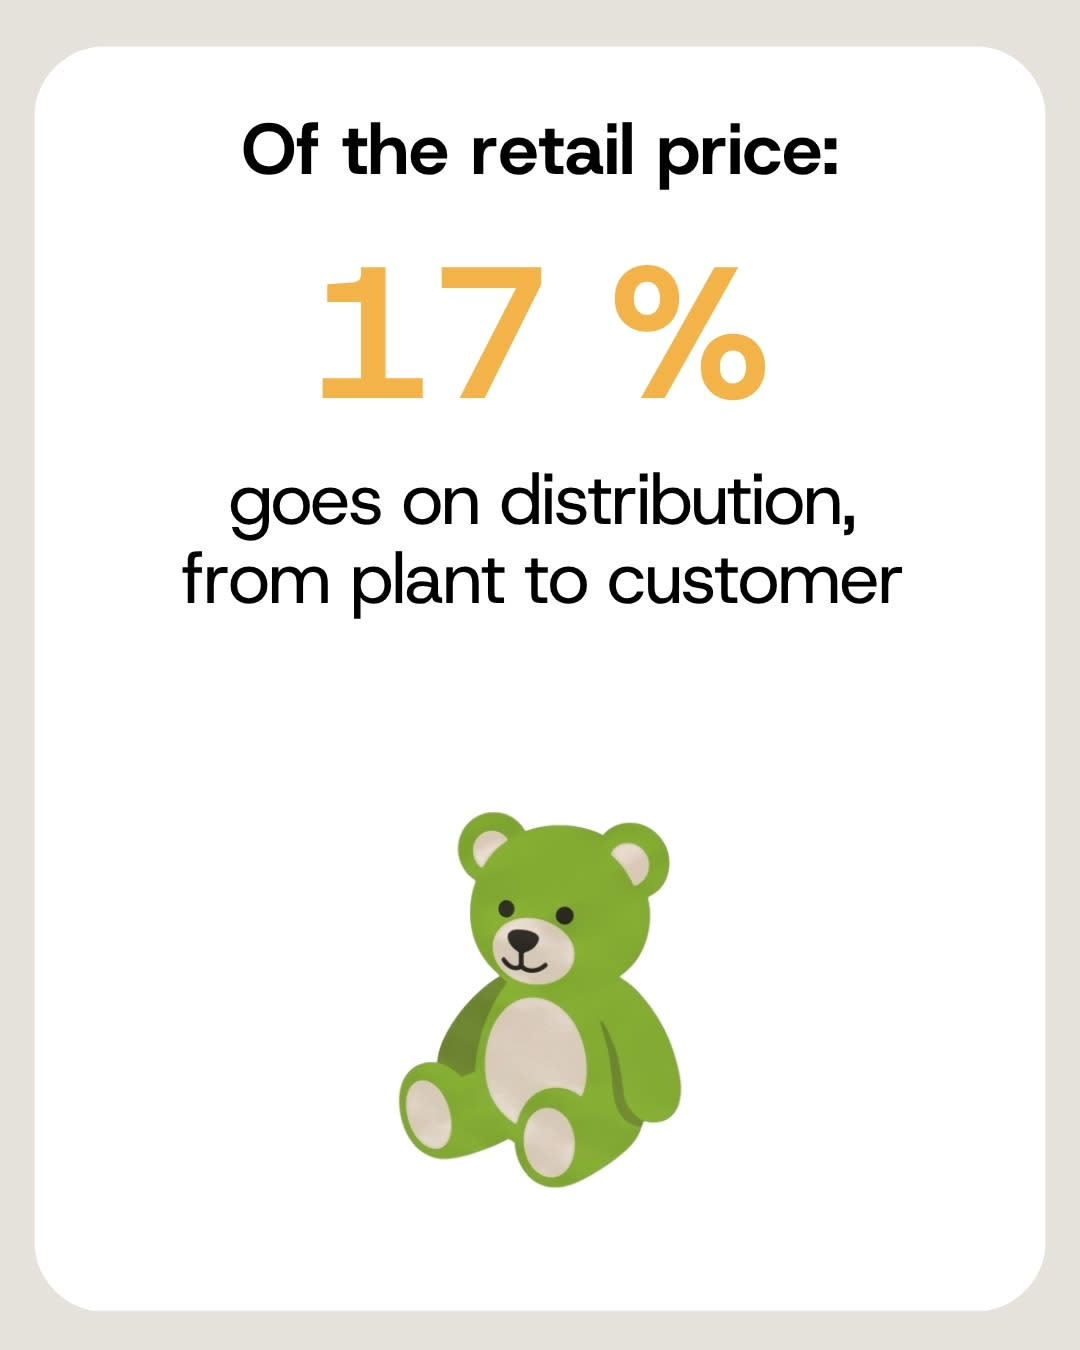
The share: 17% of the retail price
About 17% of the retail price goes on distribution, from plant to customer. Of that cost, 80% is fixed by strategy rather than by daily operations.
Put another way: by the time a dispatcher is planning tomorrow’s routes, most of the bill has already been written. Route optimization matters, but it is working on the fifth of the cost that is still open.
Eleven inputs, one answer
How much we deliver, how often, how many warehouses we run, what we drive and how far, and how many people it takes. On top of that: motorways still under construction, route planning down to the turn‑offs, how the product is packed, land prices, and contractual penalties.
All of it goes into a simulation model that generates several scenarios rather than one number. The scenarios differ in warehouse count, location and regional split, and each one carries its own cost and service profile.
The quick‑win trap
Most customers are in Prague, so the warehouse should be in Prague. It is the first thing everyone says, and the model regularly disagrees — it often points somewhere like Poděbrady instead.
Concentration of customers is one input among eleven, not the answer. The answer that sounds obvious is usually the one that costs most.
The best model is not the plan
The mathematically best network is often hard to implement and rough on the people at the end of the chain. What gets built is a compromise between it and the client’s constraints: the cash available for investment, the direction the company is heading, and what its customers will accept.
The output is a set of decisions rather than a single figure: where the warehouses go, how the regions are split, the route plan down to the turn‑offs, what gets automated, and the delivery schedule.
What to take from it
- Distribution is about 17% of the retail price.
- Four fifths of that is decided by strategy, not by daily operations.
- A distribution model takes eleven inputs, from delivery frequency to contractual penalties.
- The output is a set of scenarios, and the one that gets built is always a compromise.
The model gives you the answer that is best on paper. Our job is to find the one the client can actually run — and those two are rarely the same place on the map.
Martin Šereda, Senior Consultant, Logio
Sources and dating
Based on Logio project data from distribution network design engagements.
Originally published as a Czech infographic in 2020. Redrawn and updated in 2026.
Full infographic · PDF, 13 pages
The whole story in one file, with the figures included.
Where the stock sits: distribution strategy (EN)
PDF, 1.43 MB
More supply chain insights
Supply chain glossary
Product Portfolio Optimization
What product portfolio optimization is, how it differs from store assortment, and why each extra variant raises inventory even when sales stay flat.
19. october 2026
3 min
Supply chain glossary
Planogram
What a planogram is, what it specifies, and why its shelf capacity has to fit the delivery cycle and the case pack.
19. october 2026
3 min
Supply chain glossary
Long Tail
What the long tail of an assortment is, why it should be ranked per store cluster, and how pack sizes decide tail inventory.
18. october 2026
3 min