Whitepapers & ebooks
Supply Chain Reporting: Why the Board Gets Numbers Two Weeks Late
The delay is rarely a tooling problem. Four structural reasons why board numbers arrive late, how to find where the lag builds up, and the order in which to fix it.
02. september 2026
10 min

The delay is rarely a tooling problem. In most companies the monthly supply chain picture arrives late because the numbers have no owner, the data comes from systems that disagree, and the final assembly runs through one person. This is how to find where the lag builds up, and why automating the reports first usually makes things worse.
What a two‑week‑old number actually costs
The cost is not the analyst hours. It is that every decision gets made on a picture of the business that has already changed, and organisations compensate for that the only way they can: with buffer. More stock than the service level requires, more capacity than the volume justifies, more people in the loop than the process needs. Buffer is what a company buys when it cannot trust that it will see a problem in time.
Do the arithmetic on your own cycle. A number lands on the board slide fourteen days after month end. The decision it should trigger takes another week to agree and communicate. You are now acting on a shift that started roughly six weeks ago. If your supplier lead times sit in the four to six week range, that is one full replenishment cycle spent working from information that was already out of date when it arrived.
There is a second cost, and it is the one that rarely appears in any business case: the decisions nobody takes. A pricing correction that made sense in week two is not worth making in week seven, so it quietly gets dropped. Nobody records that as a loss. It shows up later as margin.
Cause 1: the number has no owner
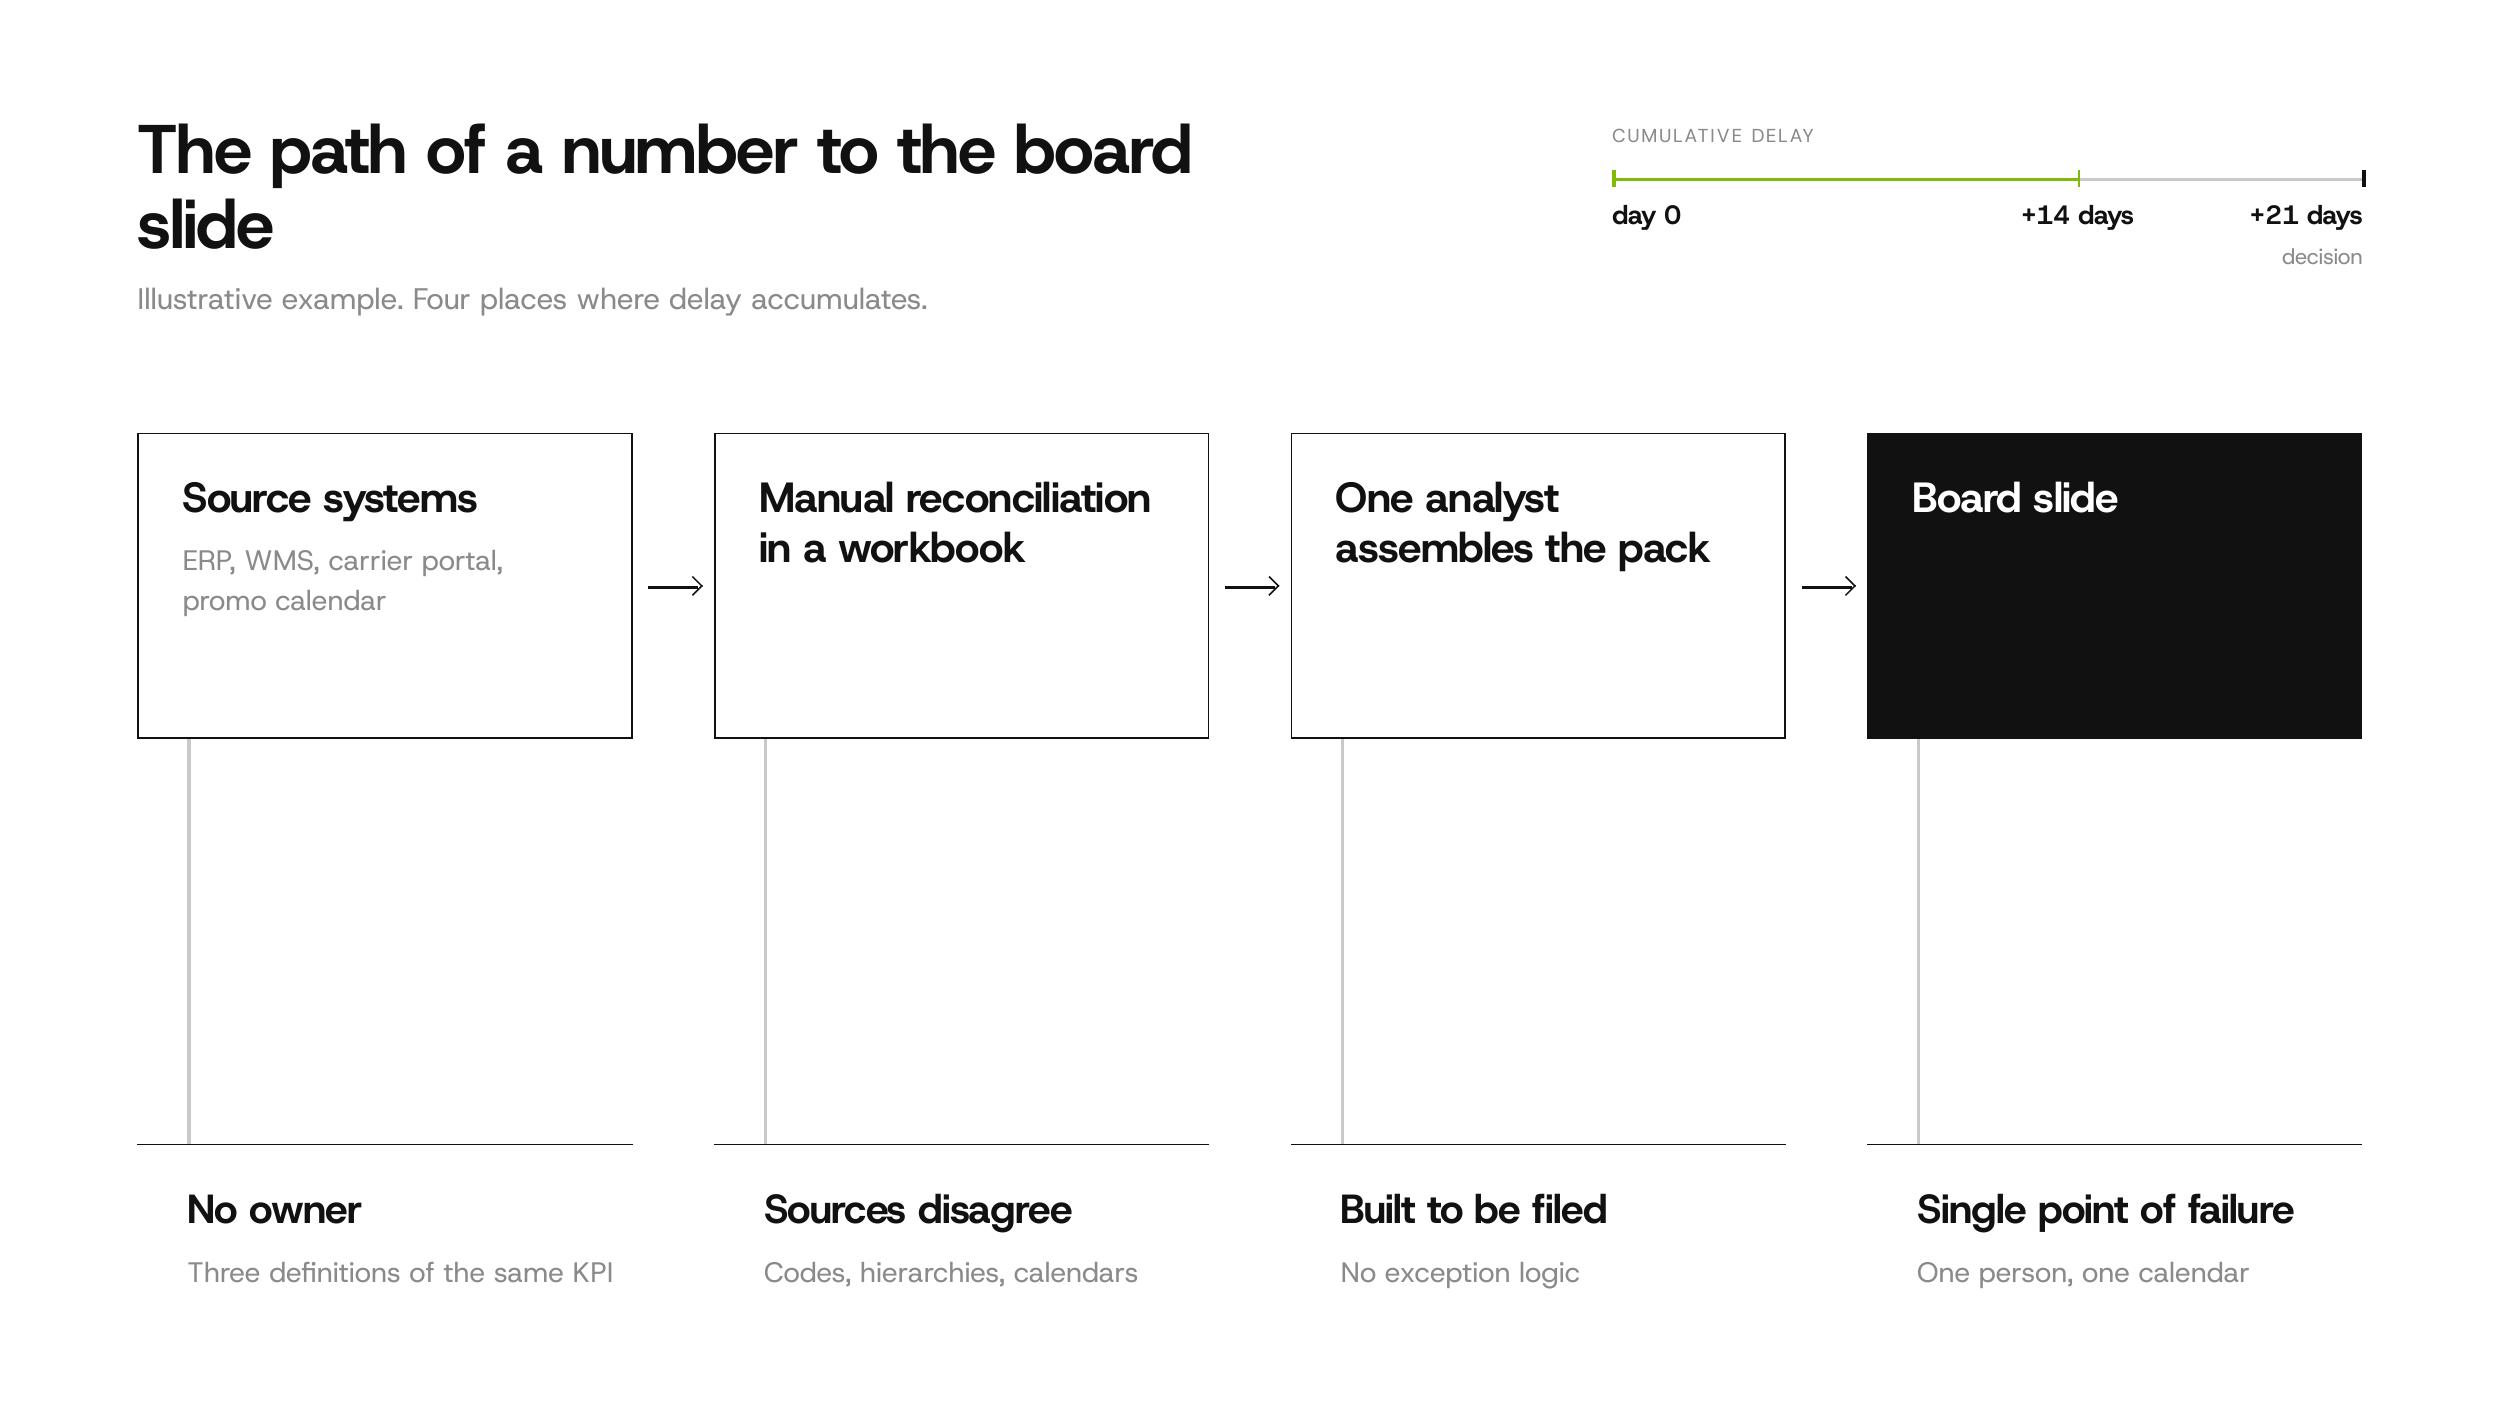
When the same KPI is calculated in three places, every reporting cycle opens with a reconciliation debate instead of a decision.
The mechanism is definition drift. Does availability include promotional SKUs, or only base assortment? Is a stockout counted per store and day, or per order line? Does the inventory figure include goods in transit? Each department answers in the way that makes its own performance legible, and each answer is defensible on its own terms. What you get is not a wrong number. You get four defensible numbers and a meeting that turns into an audit.
We saw the structural version of this at DPMUL, the municipal transport operator in Ústí nad Labem. Its operational data sat across several disconnected systems, external providers, internal spreadsheets and individual departments. Before anyone could usefully build a dashboard, the fragmentation itself had to be resolved.
The fix is not a KPI dictionary on an internal wiki. Those exist in most companies that have this problem. The fix is naming one person per number who can state what it means, and who is the only one allowed to change that definition. That is a governance decision, not a data project, and it costs nothing but the willingness to make it. KPI design and performance monitoring work usually starts here rather than with the reports.
Cause 2: the sources disagree, and someone reconciles them by hand
Your ERP, your WMS, your carrier portal and your promotional calendar each hold a version of the same week. Item codes differ, store hierarchies differ, calendars differ, and one of them counts the last day of the month differently from the rest.
That means joining the data requires judgment. Judgment is not repeatable. Whoever does the joining makes twenty small decisions that live nowhere except in their head and in the formulas of one workbook. This is why the monthly cycle does not get faster with practice, which is the clearest diagnostic signal you can get: if your close took four days a year ago and takes four days now, the bottleneck is not effort or skill. It is that the work is being redone from scratch every month.
Automation buys you very little until the master data mapping underneath is settled. A refresh schedule on top of an unrepeatable join simply produces the wrong answer on time. Data visibility and accessibility is the unglamorous part of the work, and it is the part that decides whether anything above it holds.
Cause 3: the report is built to be filed, not to be acted on
A report that does not say what changed and who should respond is a document, not a control system.
Most supply chain reporting packs are inventories of the past month. They are complete, well formatted, and require the reader to do the analysis themselves, which senior people do not have time for and middle management is not mandated for. The alternative is exception logic: thresholds that define what counts as a deviation, alerts routed to the role that can act on it, and a queue that makes it visible whether anyone did.
Arctic Fox, the Czech distributor and retail partner for Fjällräven, went through this shift during the pandemic. The value of the business intelligence tool we built was not the number of charts in it. It was that the tool prompted specific decisions about product listing, inventory structure, promotions and season readiness, at the moment those decisions were still open.
Cause 4: the last mile runs through one person
In most mid‑market companies the monthly supply chain picture is assembled by a single analyst, and it is very good work. It also means the report has a single point of failure with a holiday allowance.
Two things follow. First, when that person is away, the number is late or it is guessed, and everyone knows which one it was. Second, the credibility of the number is personal rather than systemic: people trust the figure because they trust the person, which works right up to the moment that person leaves.
This is the cause clients are least willing to name out loud, because the analyst in question is usually competent, loyal and doing the organisation a favour. Naming it is not a judgment on them. It is recognising that the company has built a control system out of one person's diligence.
Fix it in this order
The order matters more than the individual steps, because each one makes the next cheaper.
- 1. Definitions and owners. One person per number, with the authority to settle what it means.
- 2. The source model and master data mapping. One place where item, location, supplier and calendar are reconciled, so a join stops being an act of interpretation.
- 3. Automated refresh and calculation. Only now does automation pay, because now it repeats something that is correct.
- 4. Exception logic and alerts. Thresholds, routing, and a visible queue.
- 5. Self‑service and training. Give people the ability to answer their own next question, otherwise every follow‑up returns to the analyst.
The most common mistake is starting at step three, because it is the step you can buy. Automating a disputed number does not resolve the dispute, it industrialises it: three departments now receive a figure they disagree with, faster, and trust in reporting drops further than it was before the project. We have been called in to fix that specific outcome more than once, and the remedy is always to go back to step one.
There are also cases where this is not worth doing. If your operation is genuinely stable and your decision cycle is quarterly, a two‑week reporting lag is not costing you much and the money belongs somewhere else. And if you are replacing your ERP or WMS within the year, sequence matters: build the reporting model on the system you are going to have, not the one you are retiring. Getting that order wrong means paying for the integration twice.
What it looks like when it works
At DPMUL the work ran in five steps: assess the current state, design the target, align it with real planning needs, support adoption, then integrate the new approach into existing processes. The outcome was that Excel‑based workflows were replaced by structured analytics, all operational data ended up in one analytical application, and dashboards, charts and maps now support adjustments to timetables and operations that used to wait for someone to compile a spreadsheet.
That last part is the point. The deliverable was not a report. It was a shorter distance between something changing and somebody deciding about it.
This is also where our approach differs from buying a BI platform and hoping. Logio finds the problem in the data, redesigns the process around what the data shows, and builds the tool that runs it afterwards. Reporting automation done that way is an operating model change with software in it, not a software purchase with an operating model attached.
Four questions to ask at your next board meeting
Take the pack in front of you and ask, for each number on the page:
- How old is it? Not when the slide was made. When the underlying data was captured.
- Who owns its definition? One name. If there is no name, or three, you have found your first problem.
- How many hands and how many manual steps sit between the source system and this slide? If nobody in the room knows, that is the answer.
- What happens to this report if that person is on holiday for two weeks?
Those four answers will tell you more about your reporting than any vendor comparison. If they are uncomfortable, the fix starts with governance, not procurement.
Talk to an expert if you want a second opinion on where your lag actually builds up. We would rather start with those four questions than with a demo.
Frequently asked questions
Do we need a data warehouse before we can automate supply chain reporting?
Not always. A warehouse solves repeatability and history at scale, and if you are consolidating many source systems you will end up needing one. But plenty of companies get a working reporting cycle by settling definitions, fixing the master data mapping and automating a well‑defined set of numbers on top of existing systems. Buying the warehouse first is a common way to spend a year without changing what the board sees.
Is Power BI enough on its own?
Power BI, or any comparable tool, is the display layer. It renders whatever model you give it, including a bad one. The tool is rarely the constraint. The model, the master data underneath it and the ownership of the definitions are.
Should we hire another analyst instead of automating?
An extra analyst makes a manual cycle survivable, which is worth something, but it also deepens the dependency on people rather than process. If your cycle does not get faster with practice, the problem is structural and another pair of hands will not change the lag.
How do we know KPI definitions are the real problem?
Ask three departments for the same number for the same month, in writing, without telling them why. If the answers differ, you have your evidence. This takes a day and it is the cheapest diagnostic in this whole article.
More supply chain insights
Supply chain glossary
Multi‑Echelon Inventory Optimization (MEIO)
Multi‑echelon inventory optimization sets stock levels across every stage of a supply network at once, instead of optimizing each location separately.
18. september 2026
3 min
Supply chain glossary
Vendor Managed Inventory (VMI)
An arrangement in which the supplier decides what and when to ship, based on stock and sales data the customer shares.
17. september 2026
3 min
Supply chain glossary
Stock Keeping Unit (SKU)
The identifier a company assigns to a separately managed item, and the level at which demand, stock and orders are actually planned.
16. september 2026
2 min