Infographics
Behind the game: four supply chain pillars of the 2026 World Cup
From a logistics point of view, a football World Cup is four different problems at once. Living grass that has to survive the trip into a concrete arena. A billion extra pints whose distribution in time and space nobody knows in advance. Fifty terabytes per match that have to cross half of America f
05. june 2026
9 min

From a logistics point of view, a football World Cup is four different problems at once. Living grass that has to survive the trip into a concrete arena. A billion extra pints whose distribution in time and space nobody knows in advance. Fifty terabytes per match that have to cross half of America faster than a viewer would notice. And thirty thousand cars trying to leave one point on the map at the same moment. We went through all four and wrote down what holds outside football too.
Grass that travels badly
FIFA rules leave no room on one point: every match is played on natural grass. Most of the American arenas that hosted the tournament are enclosed concrete halls with artificial surfaces, built on structures that never assumed a layer of soil. Converting a single stadium costs more than ten million dollars.
Growing the grass is not the hard part. Getting it there alive is. A conventional pitch weighs far more than an indoor floor can carry, so the mass has to come down by roughly eighty percent. The turf is grown on a thin substrate with synthetic reinforcement, and only once it is inside does it get water and air. That job falls to a system under the floor that pulls excess water out and pushes air to the roots within minutes. Concrete has nowhere to drain to, so without it the pitch would drown after every watering.
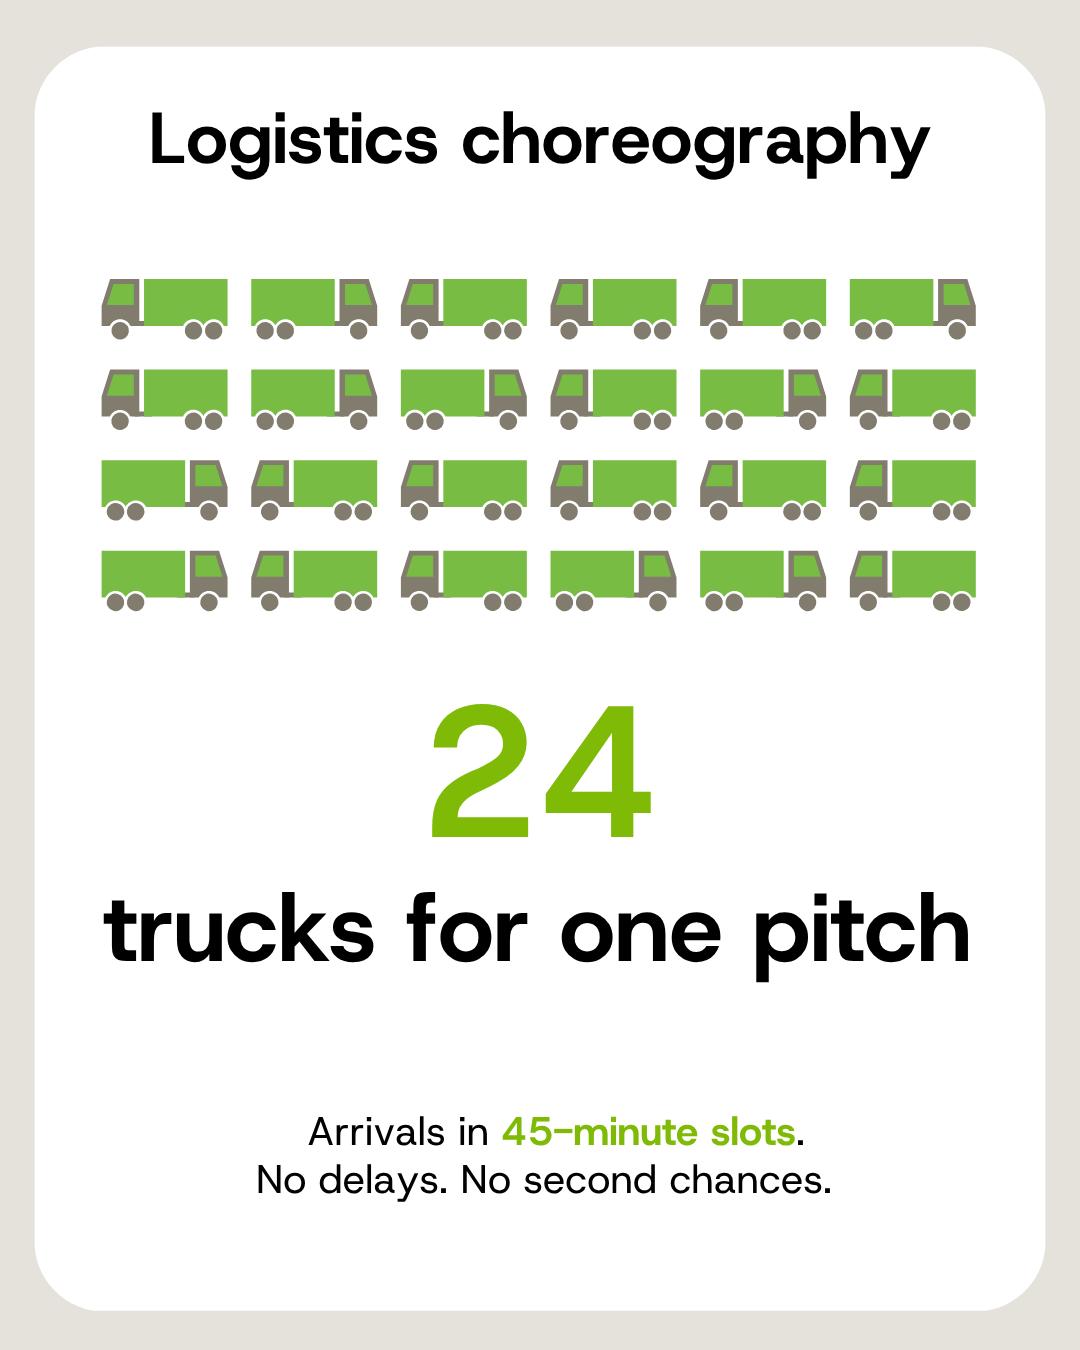
The transport itself looks more like pharmaceutical distribution than a construction delivery. Twenty‑four trucks on a forty‑five minute takt, controlled temperature, no idle time. Freshly harvested turf starts dying within hours, so the window between the field and the installed pitch is fixed and cannot be stretched. If one link fails, what arrives is not a pitch but expensive hay.
“As a football fan I have always been fascinated by stadiums. But even the most modern stadium rests on something seemingly ordinary – a well prepared pitch. The stadium provides the setting, the fans the atmosphere and the players the story. The turf is where it all really happens.”
Martin Kondr, creator of the Kopačák project and a developer at Logio
A billion pints and no idea where they go
The tournament ran forty matches more than Qatar 2022, and global beer consumption rose by more than a billion pints because of it. It sounds like a big number, and for planning purposes it is nearly useless. What matters is where and when those pints get poured.
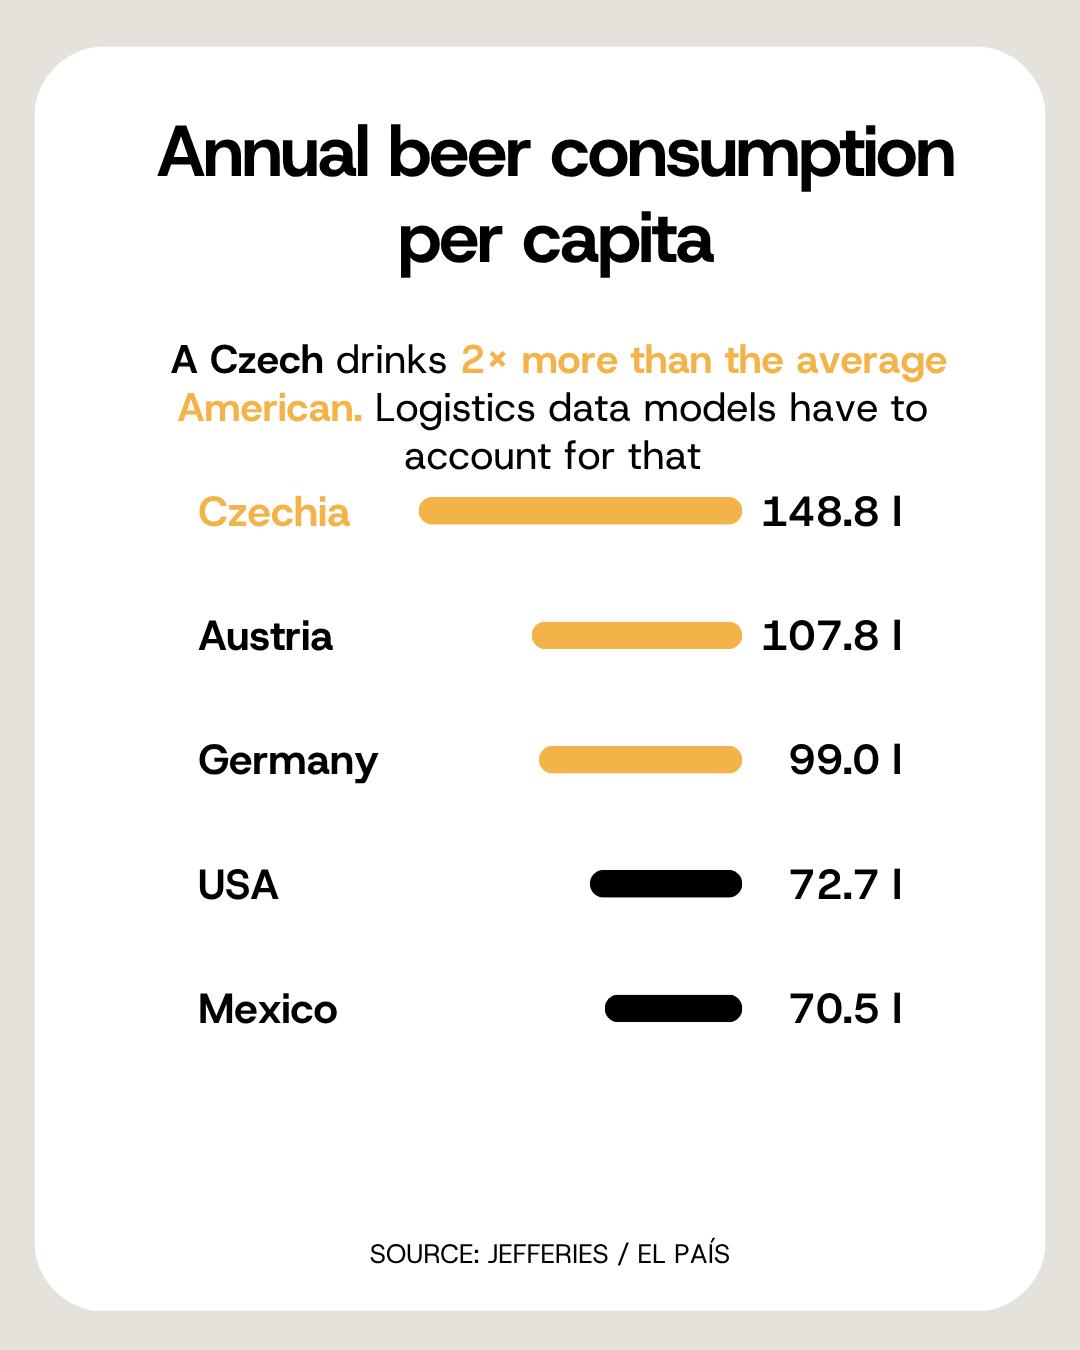
The six million pints flowing through official stadiums and fan zones do not spread evenly. It depends on who plays whom. A Czech drinks 148.8 litres of beer a year, an American 72.7. When two beer‑drinking nations meet in one host city, real demand jumps by hundreds of percent against a fixture between countries at half that rate. A model that leaves this cultural multiplier out will see local supply collapse. In Moscow in 2018 nobody included it and the taps ran dry within days.
The second trap is the classic one: the bullwhip effect. A bar pours a few kegs more than expected. It orders with a margin. The distributor adds a margin of its own. The brewery brews thousands of litres extra. The MIT Beer Distribution Game shows how a ten percent swing at the customer end compounds into a threefold one at the top. The result is shortage where people are drinking and full warehouses where the fans have already left.
The cure is boring and it works: measure instead of guessing. Smart kegs report location and remaining volume in real time, software spots an anomaly before it becomes a problem and reroutes trucks straight to the stadium ramps. At close to full truck utilization this takes a fleet a third smaller than the traditional model.
Then there is the last metre, where everything can still go wrong. Foam costs an average of twenty‑three cups per keg tapped. At half‑time eighty thousand people reach the counters within fifteen minutes, while a bartender pours around a hundred pints an hour by hand. Systems that fill the cup from the bottom through a magnetic disc cut turbulence and foam and push throughput past five hundred pints an hour. The bottleneck does not move somewhere else; it disappears.

“Guesswork is over. We now plan all demand on our algorithms, which calculate exactly how much of what is needed and when. A jump in demand shows up as a jump in cash flow, not as a problem with what we will be selling an hour from now or how to get rid of surplus stock.”
Adam Zdvihal, Senior Consultant, Logio
Fifty terabytes that cannot wait
While a traditional supply chain moves tonnes of material, at a World Cup moving gigabytes becomes just as critical. A single ninety‑minute match generates and consumes more than fifty terabytes of data inside the stadium. Hundreds of thousands of phones, dozens of HD cameras and internal connectivity all run at once through one infrastructure.
All of it goes to one place. The International Broadcast Center in Dallas covers seventy thousand square metres, runs more than three and a half thousand people around the clock and connects sixteen stadiums scattered across more than five and a half million square kilometres.
The critical consumer of capacity is the video assistant referee. Any compression artefact can mean a badly drawn offside line, so VAR works with raw video. A consumer 4K stream takes twenty‑five megabits per second; professional uncompressed 4K takes sixteen gigabits. That is six hundred and forty times as much, and several dozen such cameras run at a stadium simultaneously.
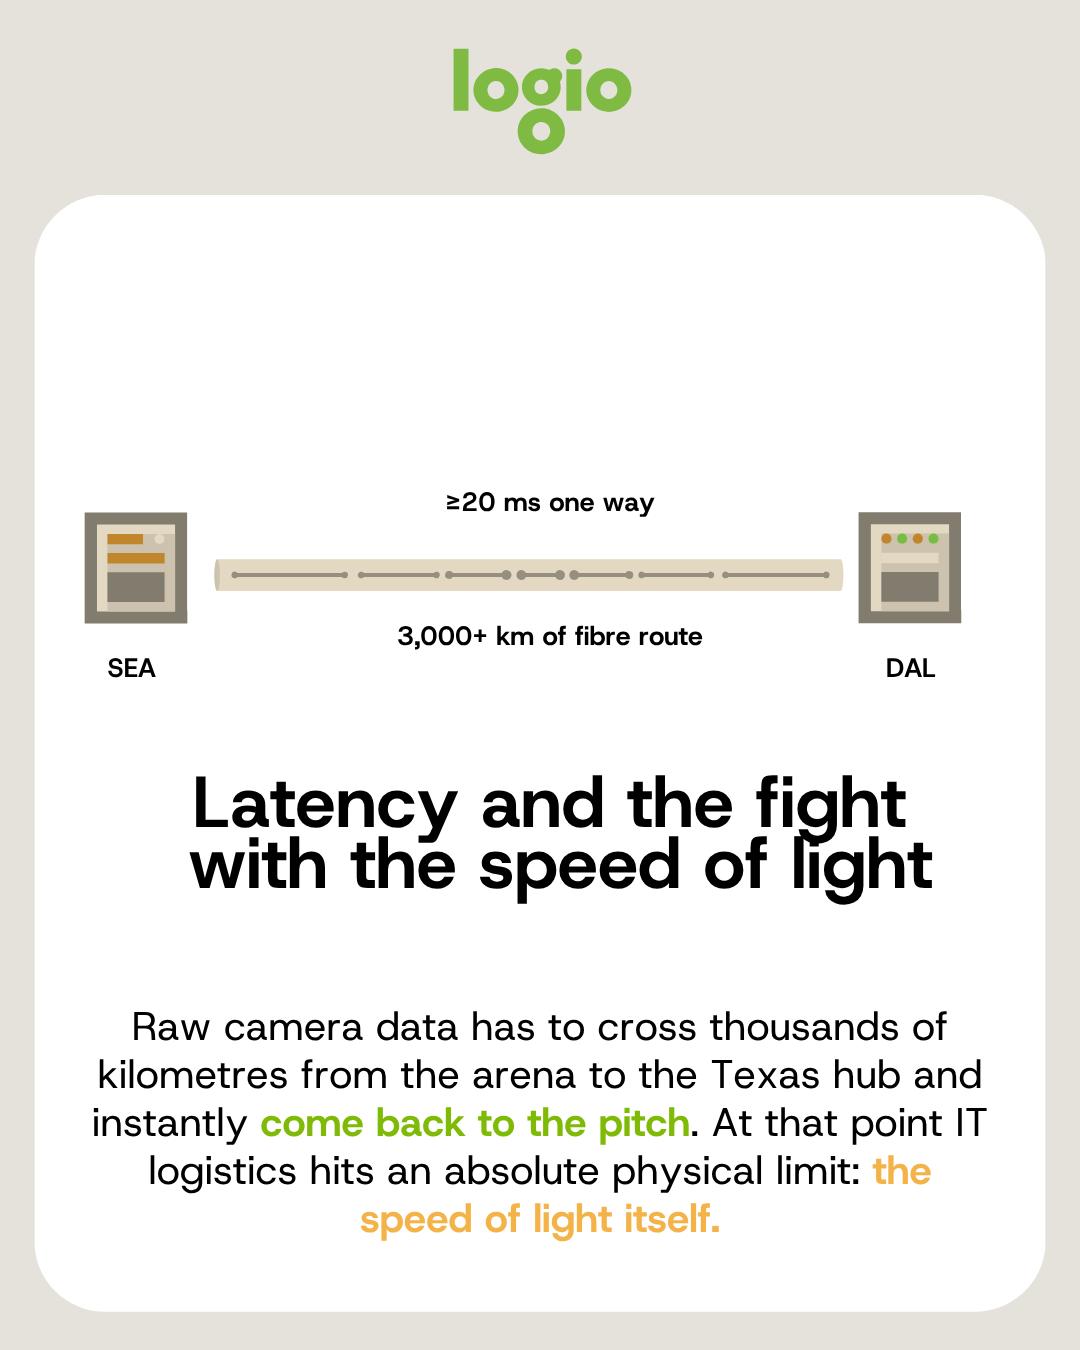
Over all of it hangs a hard time budget. When a referee is standing still with a hand on the earpiece, every second damages both the flow of the game and the commercial value of the broadcast, so the full round trip has to stay under eight hundred milliseconds. Light travels through fibre at two hundred thousand kilometres per second, so three thousand kilometres from Seattle to Dallas eats more than twenty milliseconds one way, before the image has even started working its way through routers and compression.
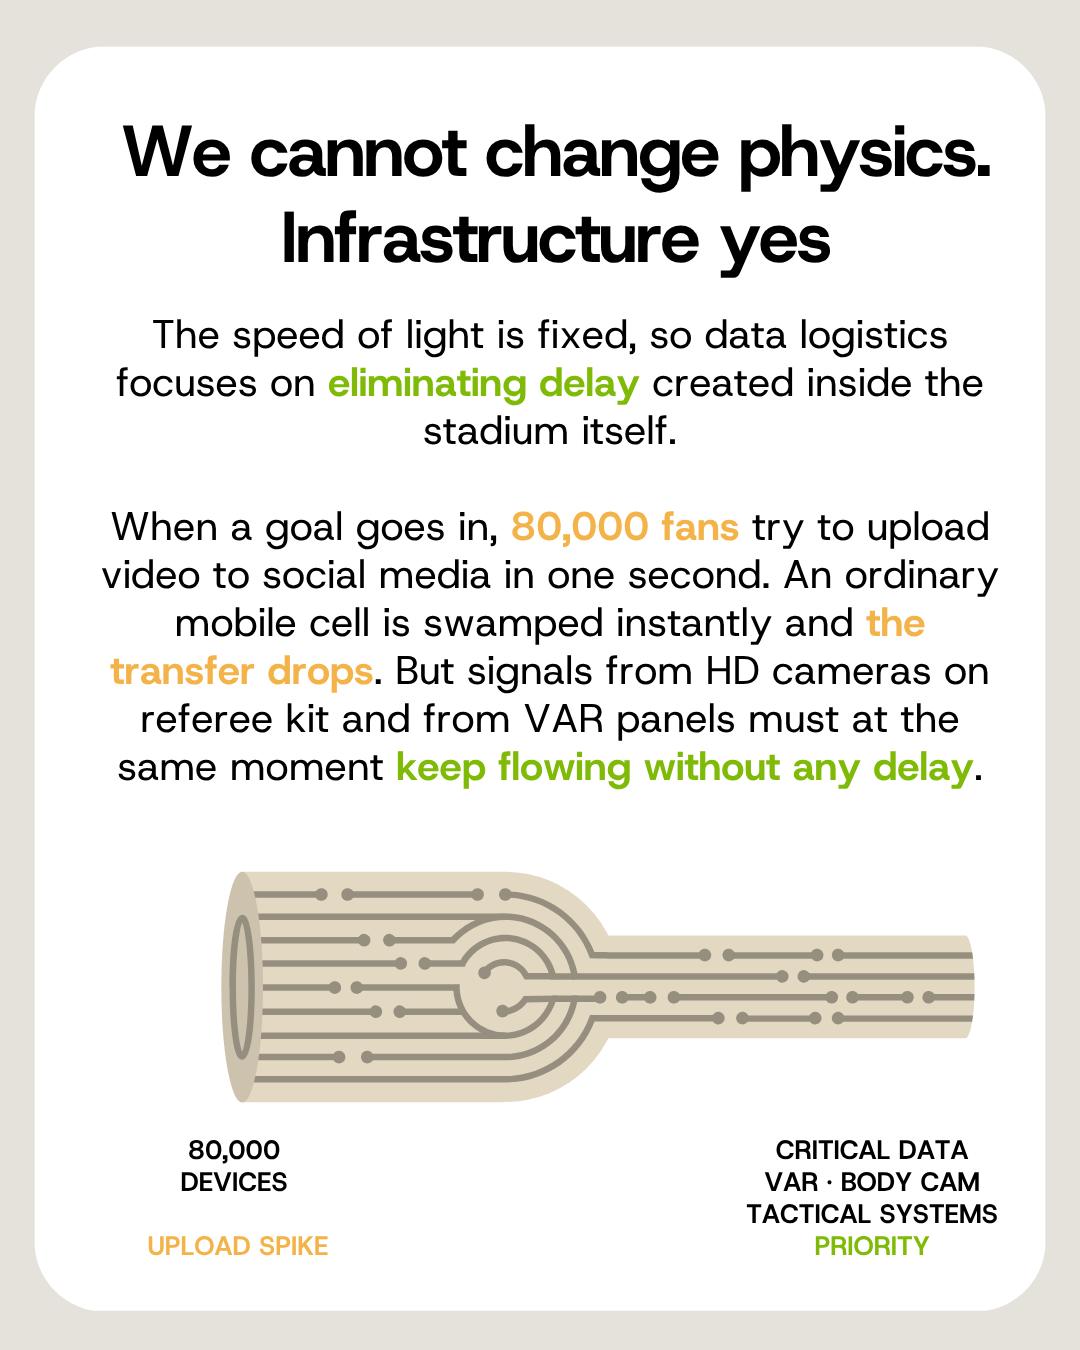
Physics cannot be changed, infrastructure can. The moment a goal goes in, eighty thousand people try to upload video in the same second and an ordinary cell saturates. The answer is slicing the network virtually into isolated lanes with guaranteed capacity. Camera and VAR traffic then runs on a dedicated lane that crowd activity cannot slow down.
“Centralising information in modern data warehouses works for logistics and manufacturing too. Data gets connected into a single working whole. That central brain then makes it possible to remove blind spots in the supply chain and replace guesswork with exact, algorithm‑driven planning.”
Petr Pokorný, Senior BI Consultant, Logio
Thirty thousand cars and one highway
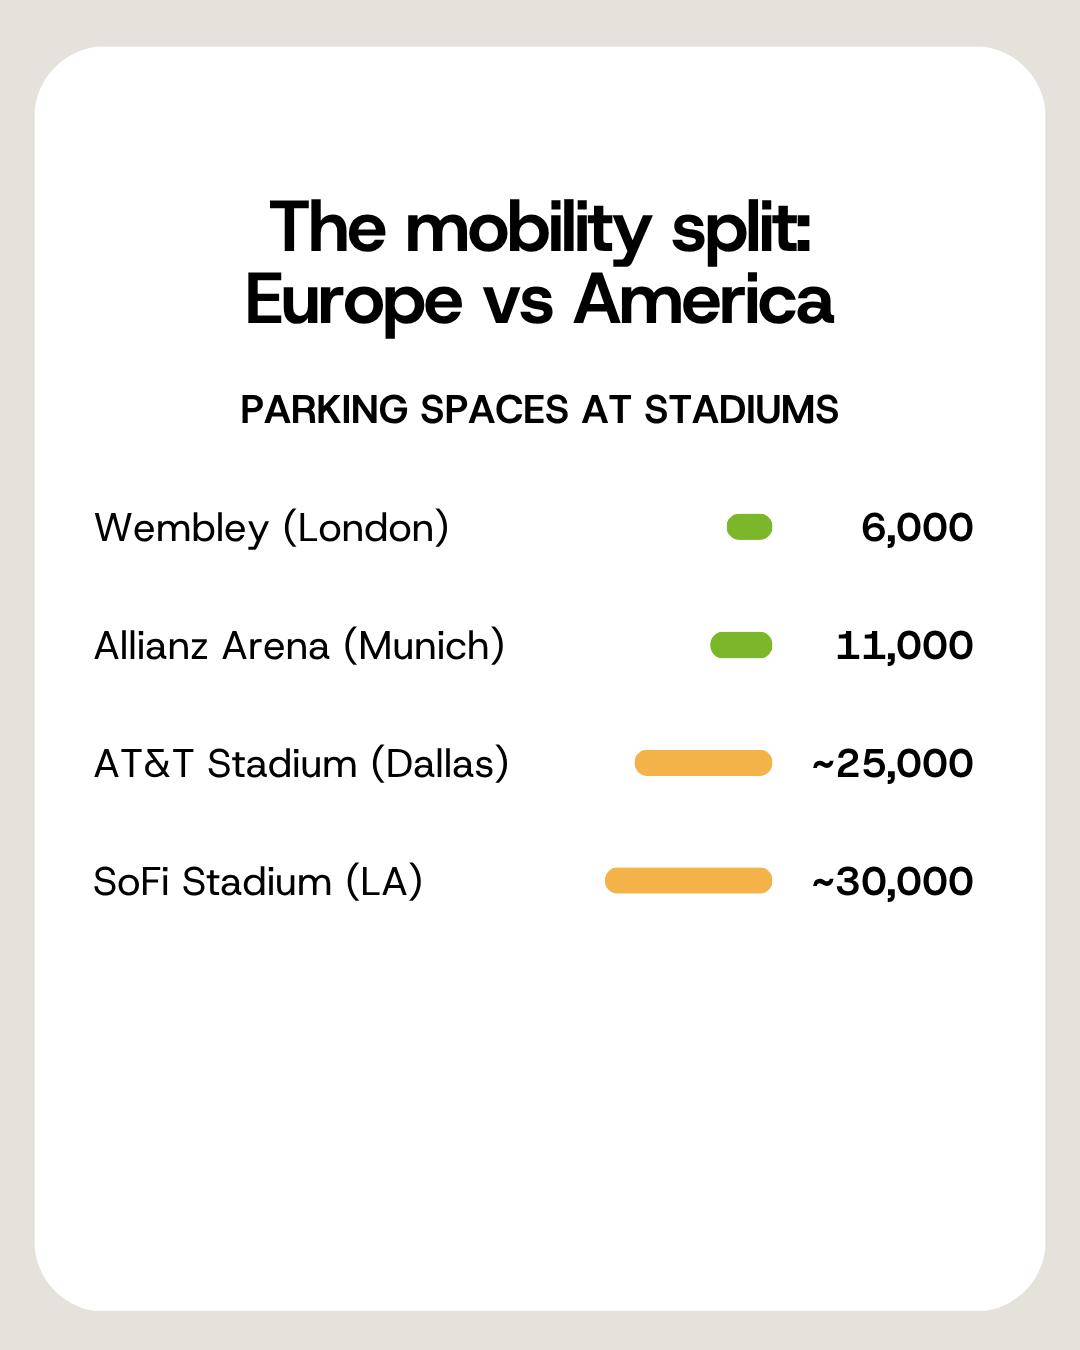
Wembley holds ninety thousand spectators and offers six thousand parking spaces. It works because seventy percent of people arrive by public transport. An American stadium of the same size offers thirty thousand spaces, because it has no other option. The United States has nine hundred and eight cars per thousand inhabitants against roughly five hundred and sixty in Europe, which is why NFL arenas were never built at transit hubs but where asphalt can absorb tens of thousands of tonnes of metal in one burst.
After the final whistle, thirty thousand vehicles hit a single point in the chain at once. Even the well‑run Allianz Arena in Munich needs two and a half hours to empty its car parks, and it has a metro line. Without one, it is an all‑night collapse.
The maths behind it is old and unforgiving. Arrival intensity into the system is λ(t), the throughput of the bottleneck is μ. As long as λ(t) stays below μ, cars get through. Once it does not, the queue grows, and its length is the integral of the difference between the two over time. Throughput cannot be raised without billion‑dollar construction, because the width of the concrete on the ramp is fixed. The only variable left is how arrivals are spread over time.
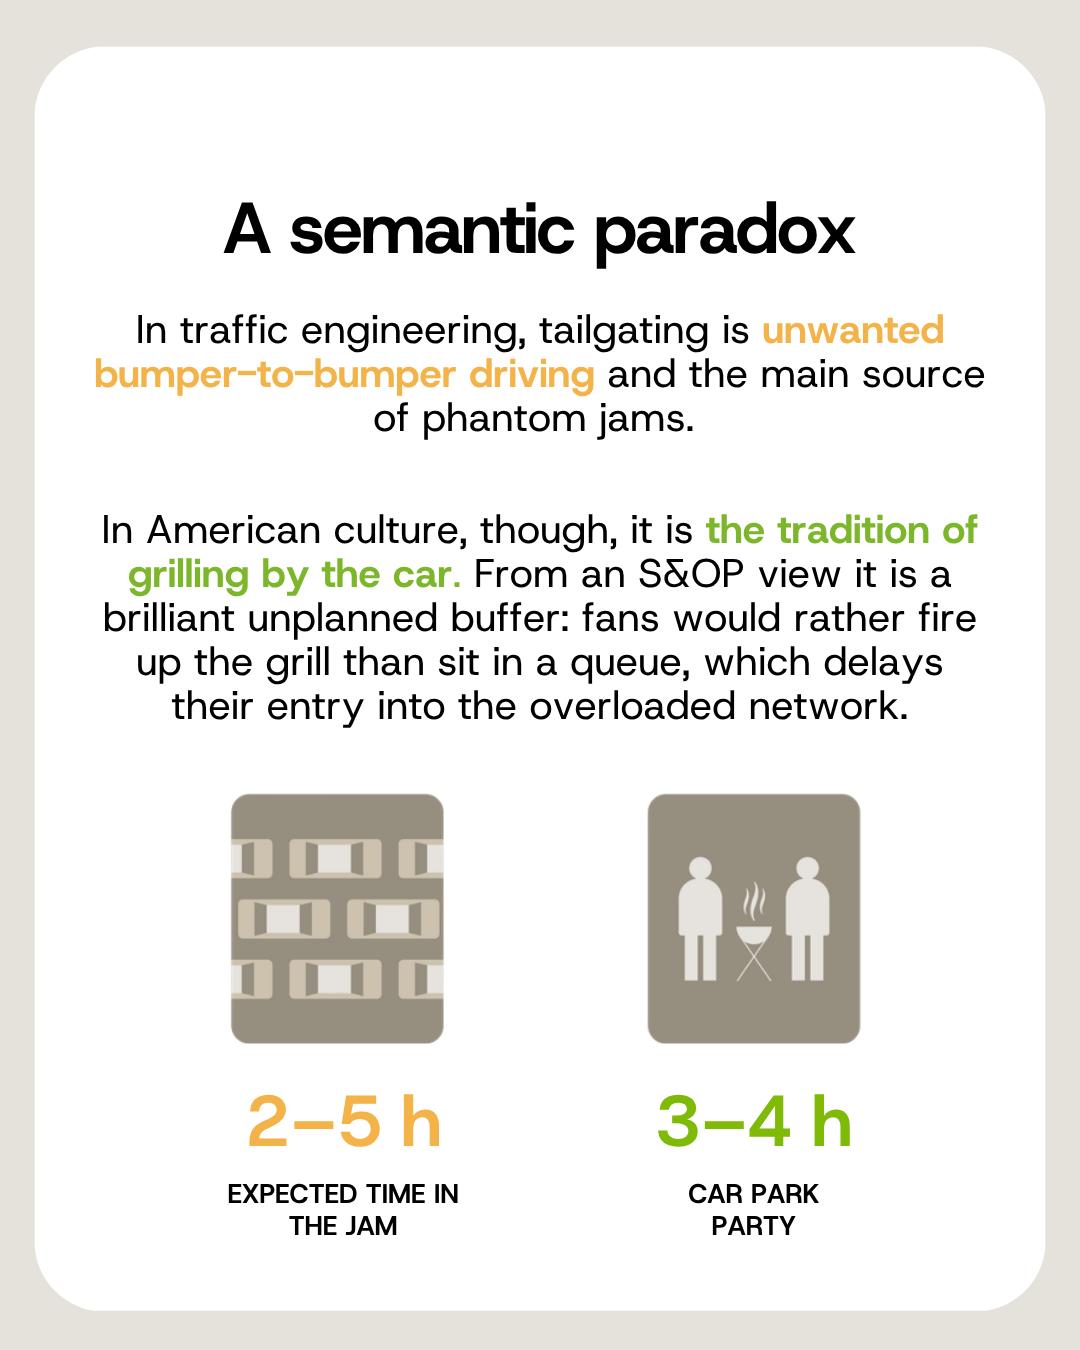
And here something enters that nobody designed as a logistics tool. In traffic engineering, tailgating means driving on someone's bumper and is the main source of phantom jams. In American sports culture the same word names the tradition of grilling at an open boot. Fans who expect two to five hours in a queue would rather open the tailgate, set up a grill and enter the system three to four hours later. From an S&OP standpoint that is textbook peak shaving: the demand curve flattens across a longer window instead of landing entirely in the first thirty minutes.
Ignoring this mechanism costs host cities hundreds of millions of dollars in lost time and paralysed commercial traffic. Deliberately spreading demand over time is cheaper than any amount of concrete.
“When we assess or design a customer's plant logistics, the capacity of entry gates and loading docks is one of the first questions. Queueing theory quantifies the efficiency of a system quickly and precisely – whether the gates are overloaded or, on the contrary, underused. For complex processes, dynamic simulation takes over from queueing theory on our projects.”
Karel Ječmen, Senior Consultant, Logio
What holds outside football
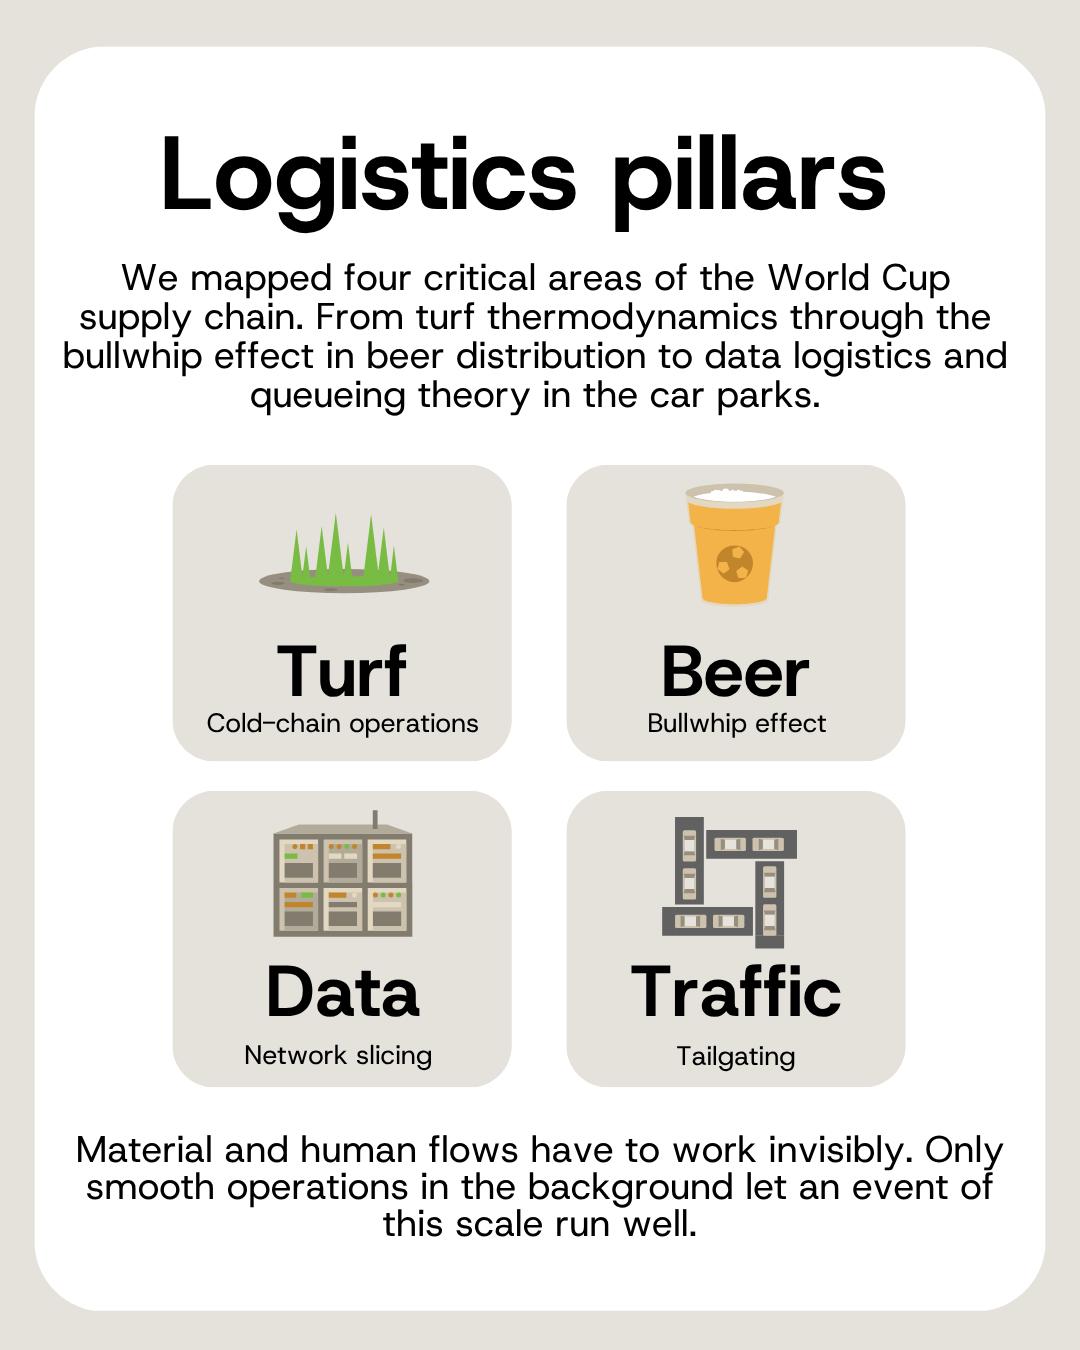
Four pillars, four different disciplines, one common denominator. Turf thermodynamics, the bullwhip effect in beer distribution, data logistics and queueing theory in a car park are the same problem underneath: capacity is fixed, demand is not, and the only things you can really work with are the distribution over time and the quality of the data you decide on.
Material, data and human flows all have to run quietly enough that nobody notices them. That is the measure of logistics built well.
The complete series · PDF, 63 pages
All four parts in one document, including figures and sources.

Behind the game — the complete 2026 World Cup infographic (EN)
PDF, 2.43 MB
More supply chain insights

Supply chain glossary
Product Portfolio Optimization
What product portfolio optimization is, how it differs from store assortment, and why each extra variant raises inventory even when sales stay flat.
19. october 2026
3 min

Supply chain glossary
Planogram
What a planogram is, what it specifies, and why its shelf capacity has to fit the delivery cycle and the case pack.
19. october 2026
3 min

Supply chain glossary
Long Tail
What the long tail of an assortment is, why it should be ranked per store cluster, and how pack sizes decide tail inventory.
18. october 2026
3 min